February 2020
The latest labour market figures published on 18 February are another set of very positive numbers with a large rise in employment in the quarter.
- Unemployment is 1,290,000, decreased by 17,000 from last month’s published figure (quarterly headline reduced by 16,000) and the unemployment rate 3.8%, showed no change on last month and also no change on last quarter.
- The ONS figure for claimant unemployed is 1,234,500, and rose by 5,500 on last month, and the claimant rate is 3.4%.
- The number of workless young people (not in employment, full-time education or training) is 962,000. This fell by 36,000 on the quarter, representing 14.0% of the youth population (fallen by 0.5 percentage points).
- Youth unemployment (including students) is 481,000, reduced by 19,000 on the quarter.
- There are 1.6 unemployed people per vacancy.
- The employment rate is 76.5% (up by 0.2 percentage points on last month’s published figure and has risen by 0.5 percentage points in the preferred quarterly measure).
Duncan Melville, chief economist at Learning and Work Institute, commented:
The quarterly numbers for employment for October to December 2019 released today are again very positive, up by 180,000 and rather difficult to explain given that economic growth remains weak - last week the ONS reported that output did not grow in the last three months of 2019. Survey indicators suggest that Brexit related, and political uncertainty has receded following the decisive results of the December general election. However, uncertainty remains high driven by concerns over the potential for a No Deal outcome to the UK-EU trade talks this year (or only a minimalist thin trade agreement).
Paul Bivand, associate director for statistics and analysis at Learning and Work Institute's said:
In early 2020, we are planning to revise these briefings. The move to Universal Credit has meant that the level and depth of information on benefit claimants has reduced dramatically, and has meant that some of our regular analysis has become more difficult to interpret. Comments and suggestions for coverage are welcome. Benefits statistics in particular are quarterly in large part (some less frequent) so these sections are likely to move to quarterly analysis.
Chart 12: Employment rate in the UK
The employment rate rose by 0.4 percentage points over the quarter, to 76.5%.
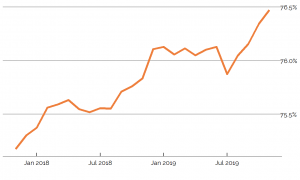
Chart 9: Vacancies – whole economy survey
Vacancies (in the Office for National Statistics survey of the whole economy) rose slightly this month, to 810,000. As the number of vacancies is quite volatile, and frequently revised, the Office for National Statistics uses a three-month average.
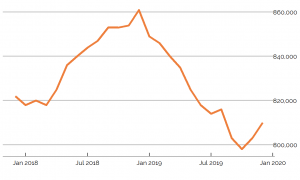
Chart 13: Claimants for inactive benefits and the economically inactive – inactivity benefits
The number of people inactive owing to long-term sickness has flattened off, while the benefit figures are showing sharper rises (with data some months behind).
This chart shows claimants of Employment and Support Allowance, and Universal Credit planning for work and those with no work requirements (both out of work) (the orange dots), compared with survey figures for the economically inactive owing to long-term sickness.
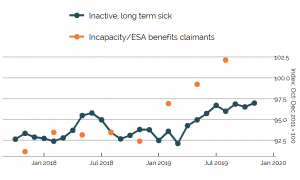
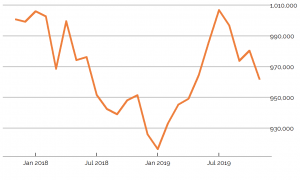
Chart 6: Young people not in employment, full-time education or training
The number of out of work young people who are not in full-time education (962,000) has fallen in the past quarter by 36,000 , or 3.6%. The fall was largely among the inactive, with the number of unemployed young people not in full-time education or training falling at a lower rate.