


Every month, Learning and Work Institute produces detailed and timely analysis of the latest labour market statistics from ONS. We examine what the figures tell us both about the health of our labour market, and what they mean for people’s experiences of work, with a particular focus on groups facing labour market disadvantage. Become a supporter to receive our monthly briefing delivered directly to your inbox and navigate our labour market dashboard.
December 2025
Stephen Evans, chief executive of Learning and Work Institute, said:
Further worrying signs in the labour market with further falls in payroll jobs. Young people, with over one million not in work or full-time education, are among those most affected, and retail and hospitality have shed 129k payroll jobs in a year. The rise in unemployment to its highest since the pandemic partly reflects a fall in economic inactivity. While this suggests more people are looking for work, it also indicates some are struggling to find work. We need a twin approach of providing more help to find work and creating the conditions for employers to create jobs.
Unemployment is now the highest it has been since January 2021 – according to the Labour Force Survey
The headline story of today’s data is that unemployment is continuing to rise. It is now (Aug-Oct 2025) 5.2% – up 0.4ppts on the previous quarter (May-Jul 2025). There has been a corresponding 0.3 ppt fall in the employment rate – now at 74.9% – and an essentially no change (-0.1 ppt) in the ‘economic inactivity’ rate.
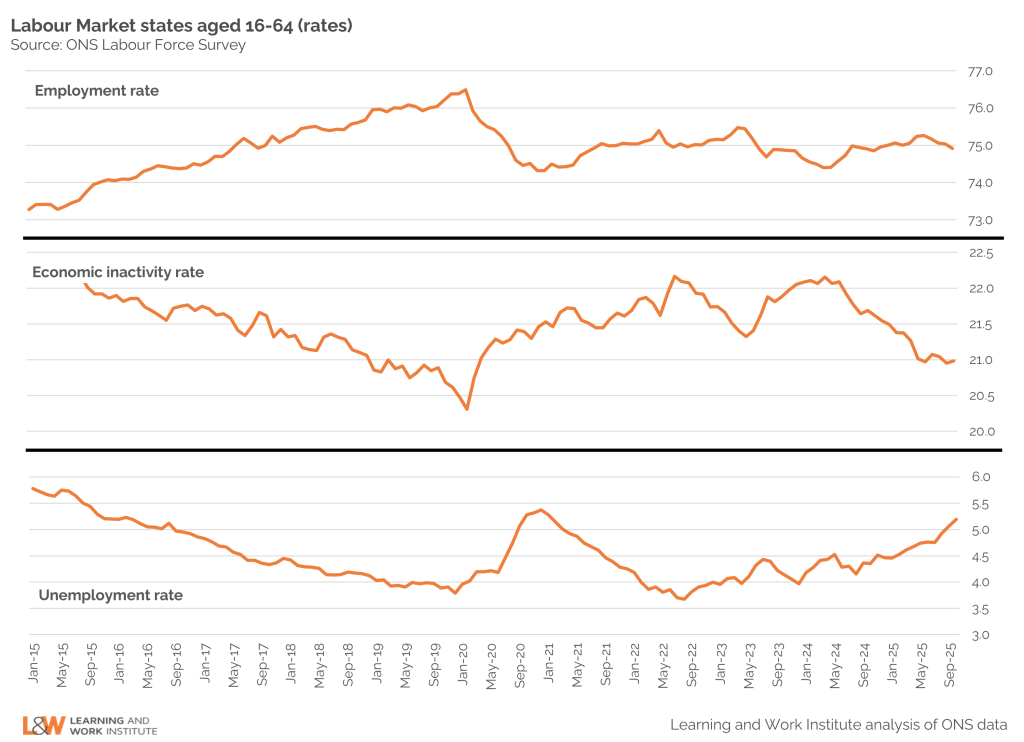
According to the Labour Force Survey, our unemployment rate is now the highest it has been since January 2021, at the height of the pandemic. We need to treat that medium-term comparison with some caution, given long-standing issues with the Labour Force Survey (see below).
There are 2.5 unemployed people for every vacancy – and many more economically inactive people who would like a job
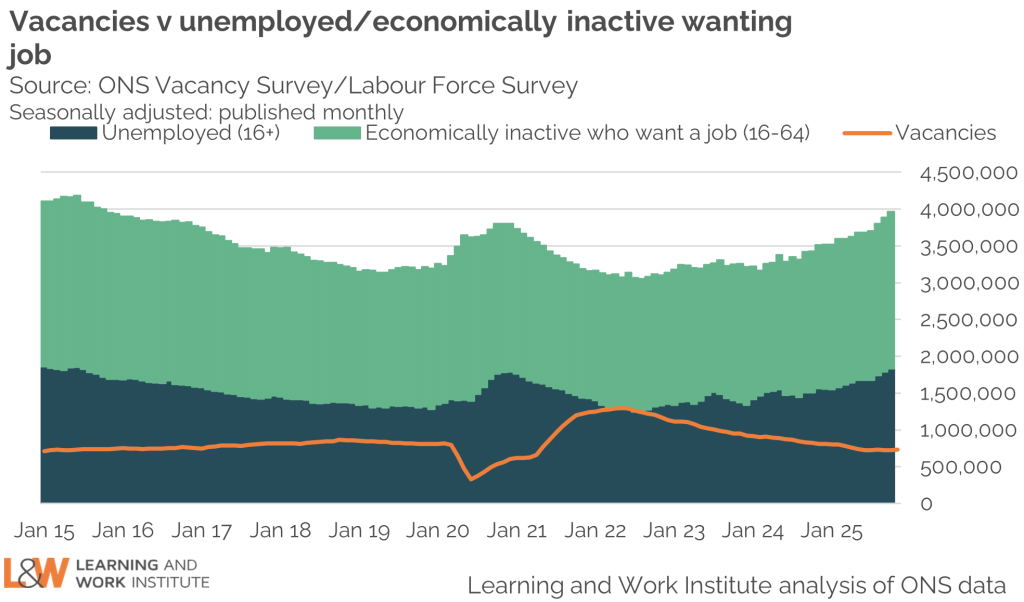
These numbers paint a picture of a cooling labour market – but is it as bad out there for job hunters as social media suggests? From graduates to recently redundant older workers, the internet is awash with testimony of talented people struggling to get an opportunity. But how hard really is it to find a job right now?
This chart suggests the problems are real. Vacancies are generally on a downward trajectory, but the number of people who are out of work and want a job are climbing. There are now around 2.5 unemployed people per vacancy (a little over 1.8 million people for the 725,000 vacancies) – but also an additional 2.13 million people who are ‘economically inactive’ (meaning they are not currently seeking or available for work) but say they do want a job.
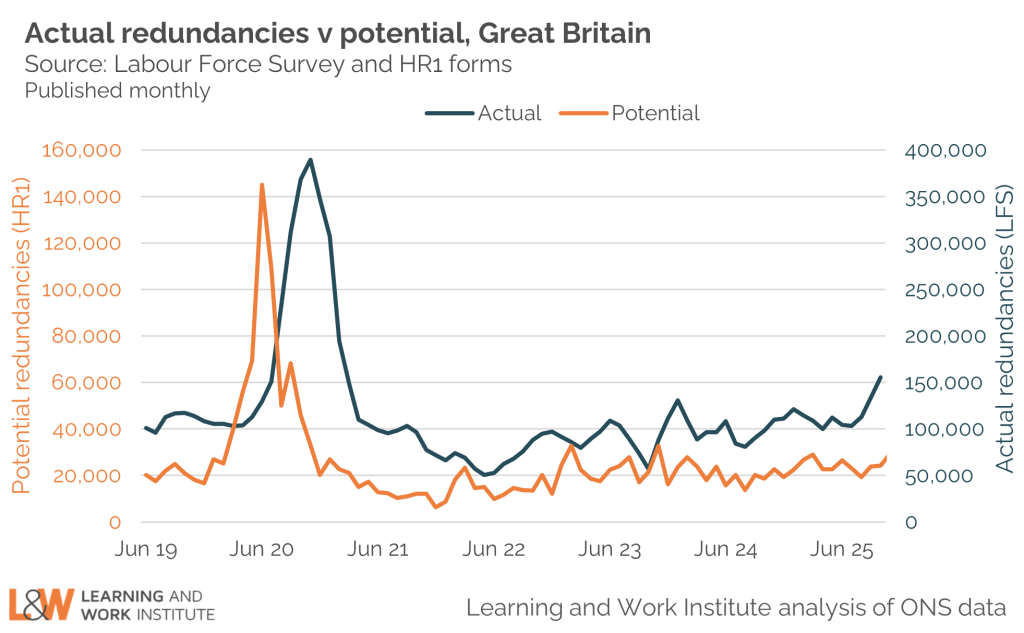
Meanwhile, there are signs of trouble ahead in the redundancy data. Redundancies are up: there were 156,000 redundancies in this quarter, compared with 99,000 in the same period last year. And there are signs of more to come: according to the official notices served by companies to the Insolvency Service via HR1 forms, potential redundancies stood at an average of 26,000 a month in the last quarter – up from 23,000 in the previous quarter.
Job numbers are up in health and social care, but way down in hospitality and retail
Data from HMRC PAYE data – which tells us how many ‘jobs’ there are in different parts of the economy – shows us more about where the pain is being felt. It’s not that surprising that the number of jobs in health and social care is growing – up 64,000 (1.4%) over the last year – given rising demand in this sector.
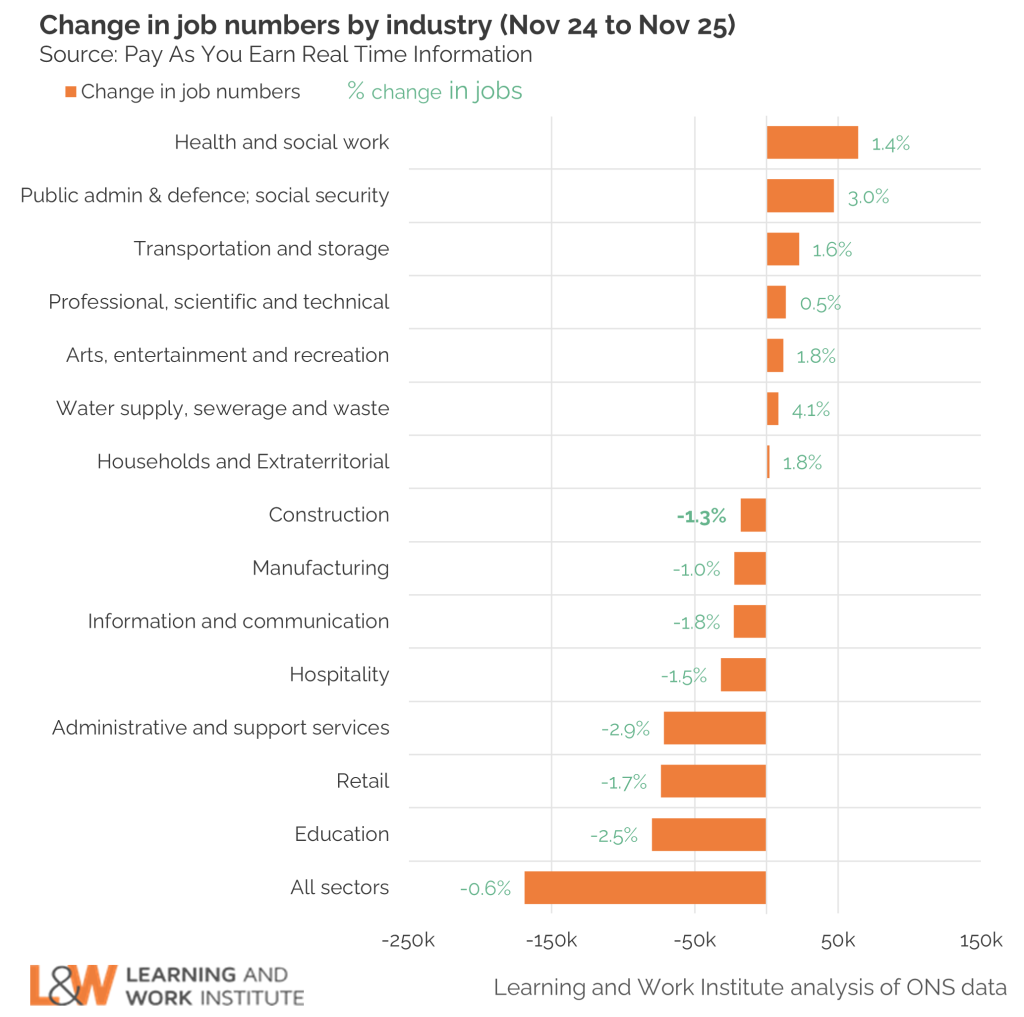
Meanwhile, retail and hospitality are two of the sectors which have seen the biggest drops – 74,000 (1.7%) and 32,000 (1.5%) respectively over the last year. That is particularly worrying in the context of growing youth unemployment and inactivity – as these sectors so often provide early pathways into work for young people. The Government’s recent announcement of a package of support for young people included ‘foundation apprenticeships’ (essentially a short on-the-job training position for young people who are not ready to take on a full apprenticeship) in retail and hospitality – but these will only work if there is demand in these sectors for new workers, and willingness to take on trainees.
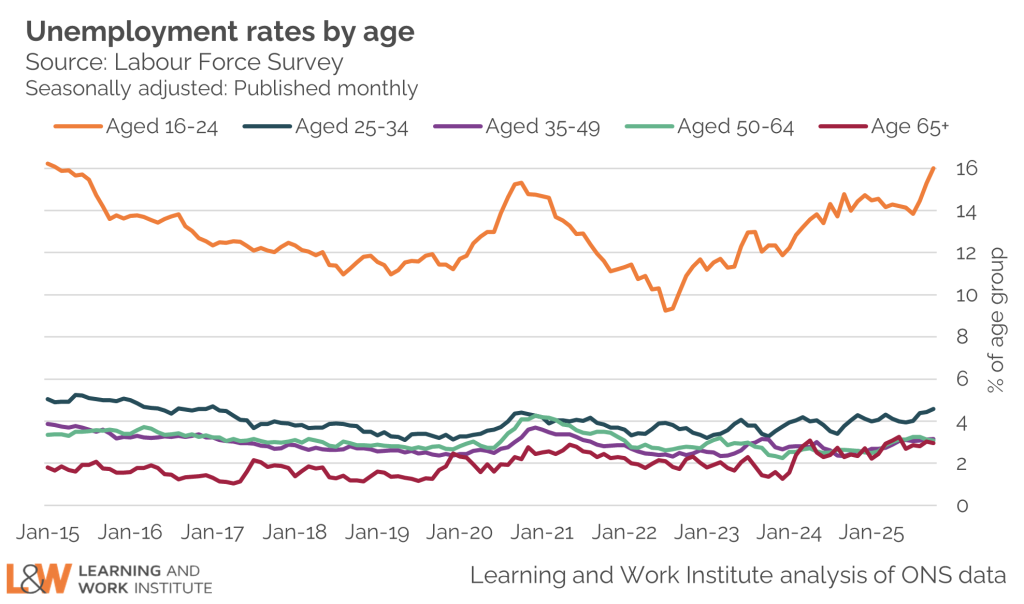
Youth unemployment has taken the largest leap, and now stands at 13.4%
The jump in unemployment is largely accounted for by the under 35s – and particularly the under 25s. Unemployment among 18-24s now stands at 13.4% – up from 11.6% the previous quarter.
This is very worrying for the Government – NEET levels (young people age 16-24 not in employment, full-time education or training) are now up to 1.25 million. The rate of young people who are NEET has been on an upward trajectory since the pandemic – particularly over the last couple of years.
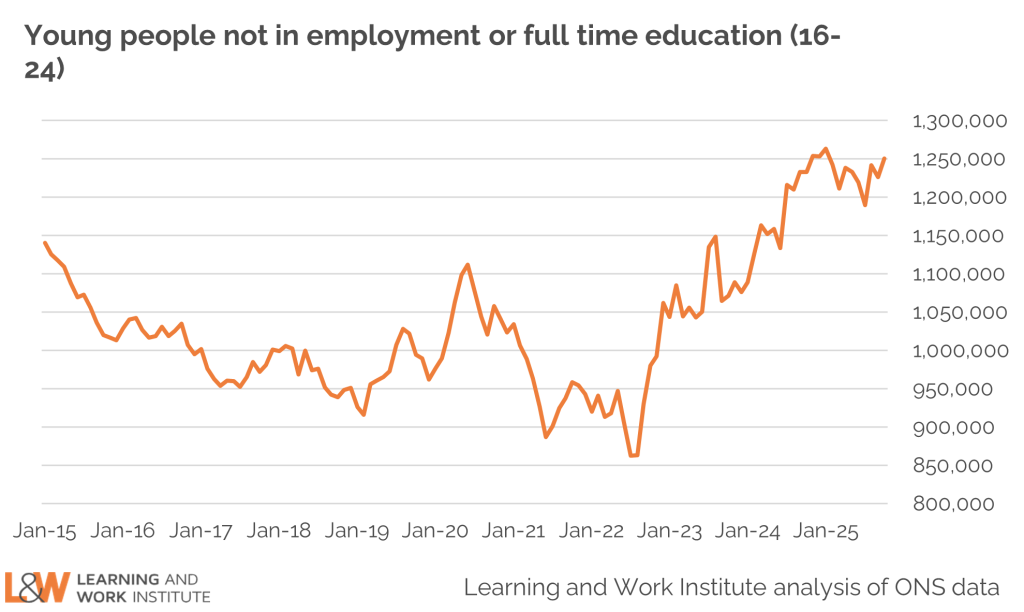
The Government has responded to this challenge with a meaty package of support for young people: including new job placements (particularly for young people who are long-term unemployed), extra support for those who have been unemployed for a few months, and an expansion of local ‘youth hubs’. However – it is worth noting that most of the additional funding will go on support for young people who are unemployed and claiming universal credit – who only account for around 1 in 4 NEET young people.
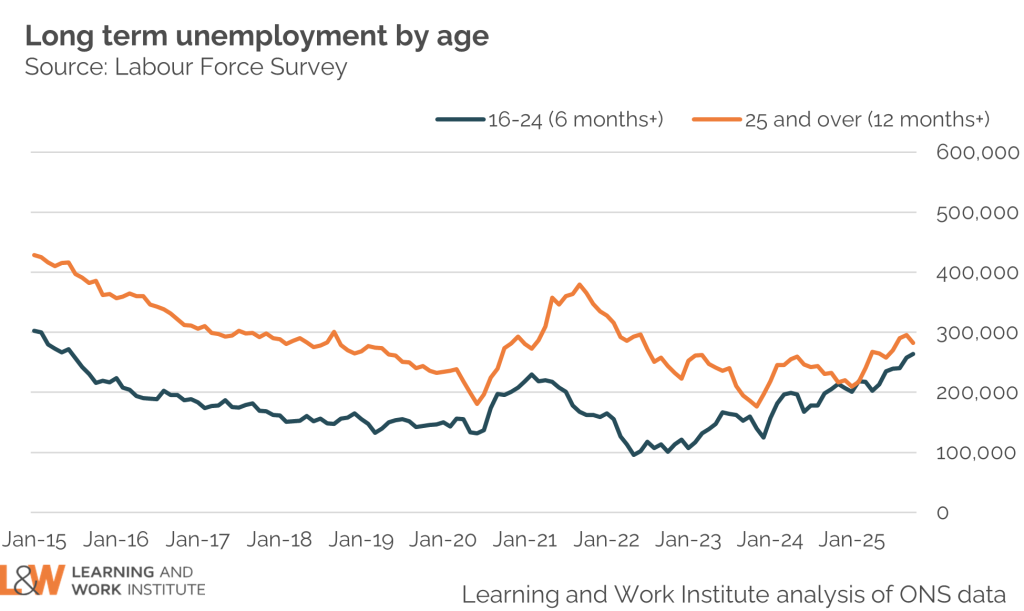
Levels of long-term unemployment amongst the under-25s has been on an upward trajectory for some years – but adult unemployment is also now going steadily in this direction. Long-term unemployment for the over 25s currently stands at 282,000 compared with 270,000 the previous quarter, and 232,000 the same time last year.

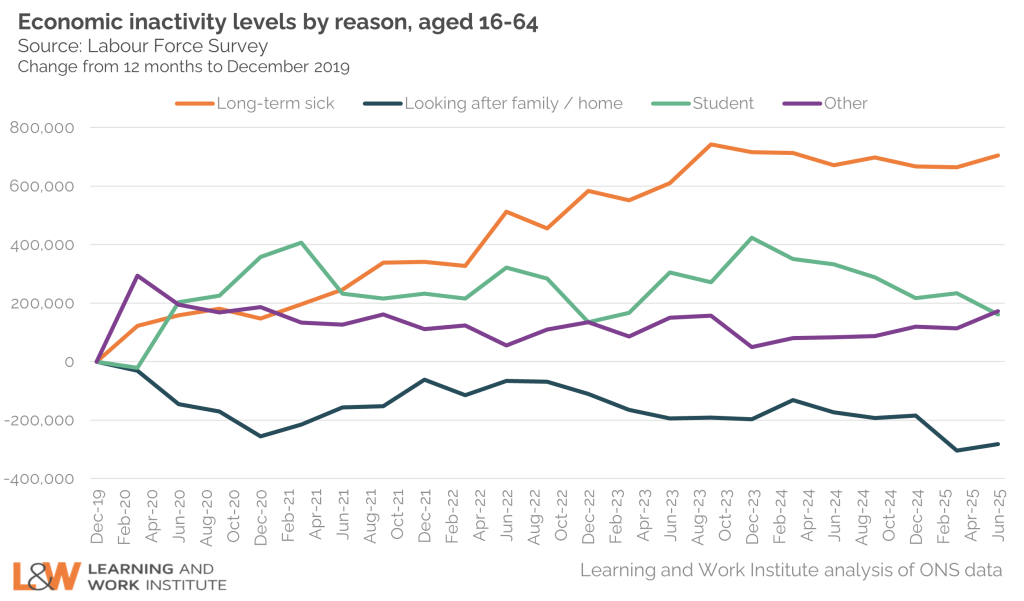
There are nearly 700,000 more people out of work due to ill health than on the eve of the pandemic
Unemployment has now replaced economic inactivity as the ‘big’ labour market story, but there is still a problem here. There are now 2.8 million people age 16-64 who are out of the workforce due to ill-health. That number has been fairly steady over the last couple of years – but is a substantial 692,000 (33%) higher than on the eve of the pandemic.
The Government’s current activity to tackle this issue is less immediate than its response to the youth problem: the independent ‘Mayfield Review’ into tackling health-related job exits recommended focussing on building the evidence base for now, while the ‘Timms review’ into Personal Independence Payments (which should include recommendations relating to employment support for people out of work due to ill-health) is not due to be published until next year.
Of course – the two issues are not separate, and the recently-announced review into youth unemployment and inactivity by former health sectary Alan Milburn is also likely to focus heavily on the impact of health (particularly mental health) on rising NEET levels. But this again is a ‘review’. The health and work agenda – despite high profile – does not currently have a programme of near-term national policy action to tackle it.
Our concern is that – again – this is a group that is largely locked out of employment support, which could help to build confidence and identify steps into or towards work. We have recommended the creation of ‘Work Support’ conversations for those claiming UC-Health, to bring more people into contact with the parts of the system that can offer support to navigate the jobs market.
Wage growth is better than it might be – but well below where it could be
Meanwhile, the picture for those in-work also has its challenges. The latest data shows a boost to public sector wages over the last year – a 7.6% increase in average regular earnings – reflecting the timings of some pay review body decisions, and growth of 3.9% for private sector workers.
Overall, average earnings grew by 4.6% in the year to October 2025, slightly lower than the 4.7% rise that was seen in the year to September 2025 and down from the post-pandemic peak of 7.9% in August 2023.
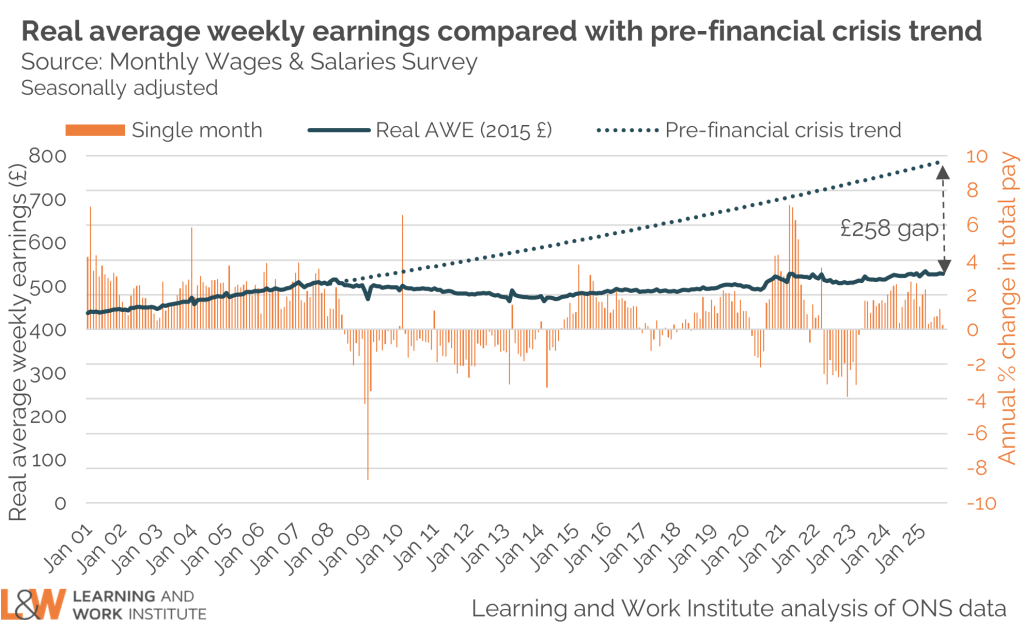
This leaves us still well below the pre-financial crisis trend of wage growth – to the extent that we probably need to start a new trend line. But it is important to underline that this sluggishness in wage growth – and the stagnant productivity rises which underpin them – have deep roots in the structure of the economy that has developed over the last 15-20 years. Sustainable improvements require faster productivity growth among other things.
Can we trust the data?
Our headline indicators are based on data from the Labour Force Survey, but since the pandemic this has experienced a decline in the response rate which affects the reliability of estimates from this source. This is illustrated by the divergence in the employment rate estimated from the LFS and other sources over this period. While the ONS seeks to resolve these issues, we are publishing an experimental estimate of the employment rate based on an approach developed by the Resolution Foundation and using administrative data sources, such as HM Revenue and Customs payroll and self-assessment data on the numbers of people self-employed.
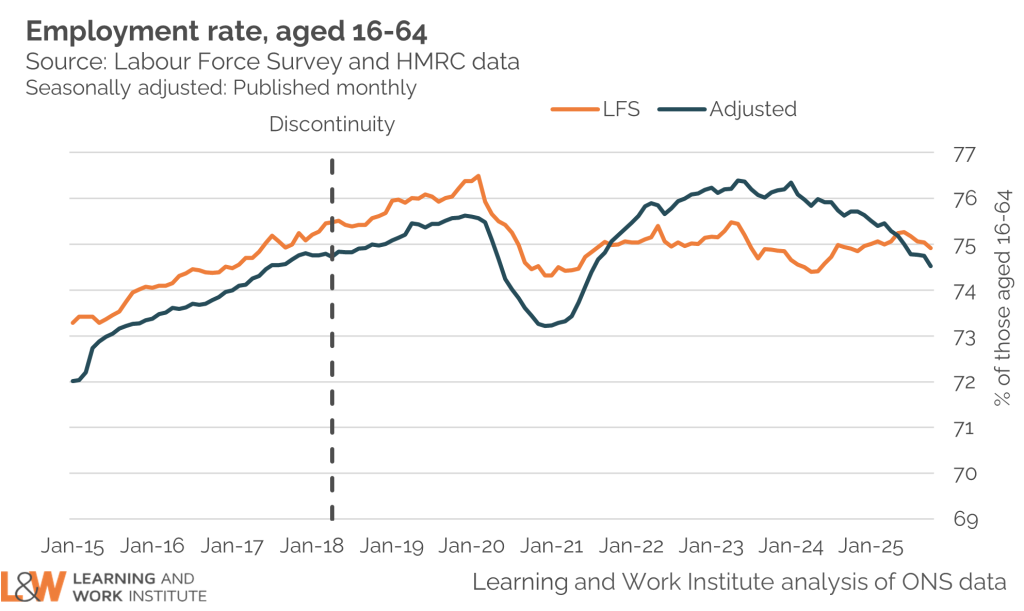
The divergence is substantially less stark than it was – suggesting that the LFS is becoming more accurate. However, while the short-term trends may now be starting to align in the two data sources, the adjusted data series points to a much sharper decline in employment rates over the last year (from a higher starting point) – further evidence of a cooling labour market, and confirmation of the headache this Government faces.