


Every month, Learning and Work Institute produces detailed and timely analysis of the latest labour market statistics from ONS. We examine what the figures tell us both about the health of our labour market, and what they mean for people’s experiences of work, with a particular focus on groups facing labour market disadvantage. Become a supporter to receive our monthly briefing delivered directly to your inbox and navigate our labour market dashboard.
February 2026
Stephen Evans, chief executive of Learning and Work Institute, said:
Low economic growth and rising employer costs continue to take a toll with a worrying one in seven 18-24 year olds now estimated to be unemployed. Overall, employment is falling, unemployment rising and vacancies flat. The data are, however, subject to revision: last months estimated 42,000 fall in payroll employment has now been revised to just 6,000. Nonetheless weaker hiring demand from employers, particularly in retail and hospitality where 122,000 fewer people are in payroll employment, is having an impact.
Are there enough jobs?
If the big post-pandemic labour market question was ‘are there enough workers’, the big question in 2026 is ‘are there enough jobs’? There are global phenomena driving this concern (eg. general economic uncertainty, tariffs and trade barriers, the potential for AI to replace jobs) and domestic ones (eg. new employment rights and increased hiring costs). Anecdotes abound of professionals unable to find work, or graduates unable to get a foothold in the labour market.
In this month’s briefing, we’ve focussed our attention on what the data actually tells us. This is not a complete picture – the Labour Force Survey remains troubled, and other data sources provide a partial and/or lagged picture. But overall, it is clear that hiring is slowing down – with particularly challenging consequences for those trying to enter the labour market for the first time – predominantly young people.
Across all metrics, it is worth noting that we are climbing down from a post-pandemic peak – when hiring and job moves shot up. The labour market is easing, but not falling off a cliff – with consequences hitting certain sectors (retail and hospitality), groups (young people) and places more than others.
At the same time, a stagnant labour market is not what this Government promised when they came into office. They committed (and later ‘aspired’) to reach an 80% employment rate. No clear timeframe was given, but nearly 18 months after the election the employment rate is…where it was when they started. We are not global outliers in this – although we face specific domestic challenges that other nations do not. For now, various long-term policy moves – the industrial strategy, youth employment programmes, work and health initiatives – will need to start bearing fruit soon if that aspiration is to be kept alive.
Unemployment is up nearly 1 percentage point on a year ago – but employment is flat
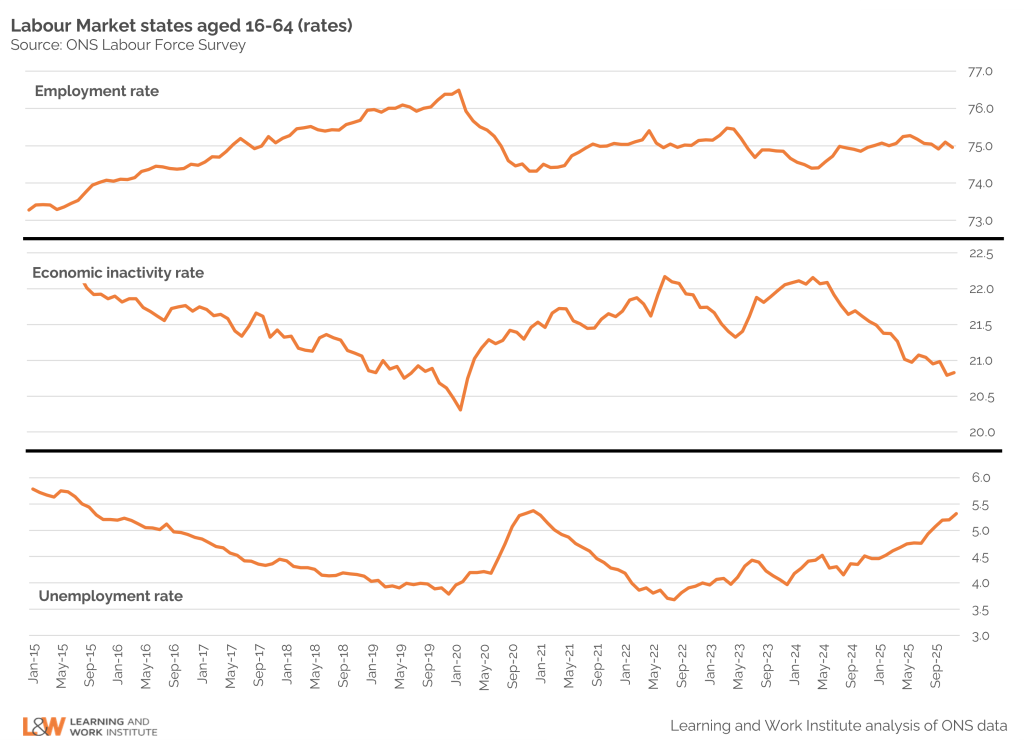
The big headline being pulled from today’s stats is a further rise in unemployment: now 5.3% – up 0.2 ppts on the previous quarter (July-Sep 2025), and 0.9 ppts on this time last year (Oct-Dec 2024). There has not been a similar hit to the employment rate – which is essentially flat at 75.0%. Rather, the proportion of people who are economically inactive – neither in nor seeking work – has fallen (down 0.7 ppts from a year ago) to 20.8% in the most recent quarter. The story here: there are now more people looking for a job. Are there jobs for them to go into?
Vacancy levels have flattened off after a period of consistent decline
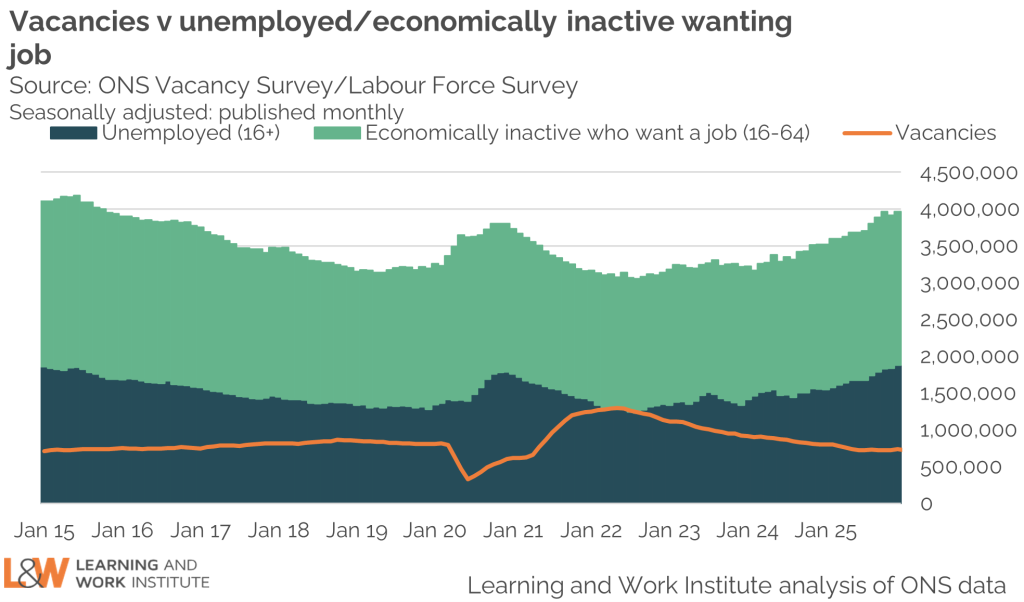
Vacancy levels – estimated by the ONS via a survey – are broadly flat. This is good news, when compared with the medium term picture: vacancies fell consistently post-pandemic before starting to level off last year. However, as this chart shows, competition is growing: in Oct-Dec 2025 there were 2.6 unemployed people for every vacancy – up from 1.9 a year previously (Oct-Dec 2024). Adding in the people who are economically inactive but say they would like to work, that number rises to 5.4 potential workers for every vacancy.
There are now more people leaving jobs than there are starting new ones
This challenging jobs market becomes clearer when we look at the number of people actually moving into new jobs. There are now around 600,000 people starting new jobs (according to the HMRC’s PAYE records) every month – down from a peak of above 700,000 in 2022.
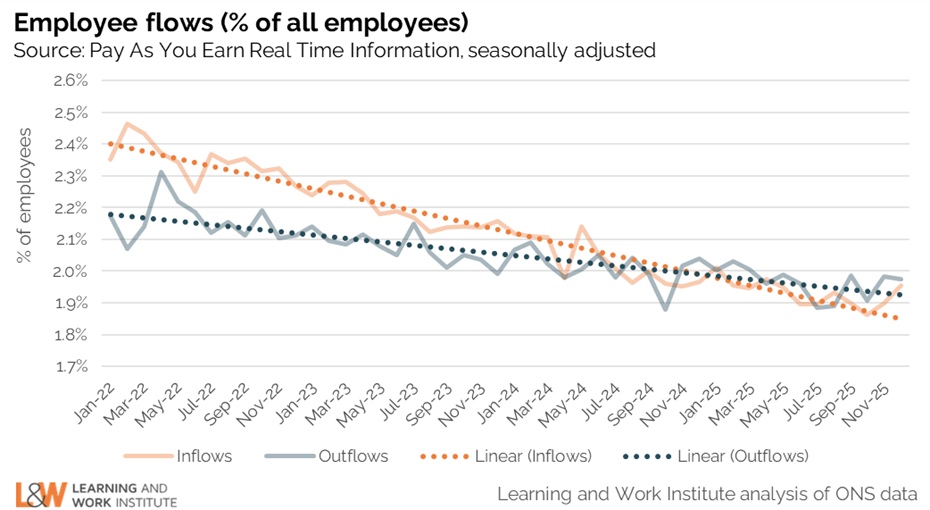
This fall means that the number of people leaving jobs is now higher than the number starting new ones. While both inflows (moves into new jobs) and outflows (moves out of jobs) have been falling since the pandemic, the former has declined much more steeply. This points to a jobs market with contracting opportunities – a challenge for anyone trying to get back into work following a job loss, or entering employment for their first time.
Moving from the HMRC’s administrative data to the Labour Force Survey, we can investigate specifically how many people are moving from one job to another – a good indication of how dynamic the labour market is. The data is a little noisy – but the overall trend over the last four years is downwards: around 2.8% of the workforce were moving jobs each year in Oct-Dec 2022, compared with 2.1% in the latest data.
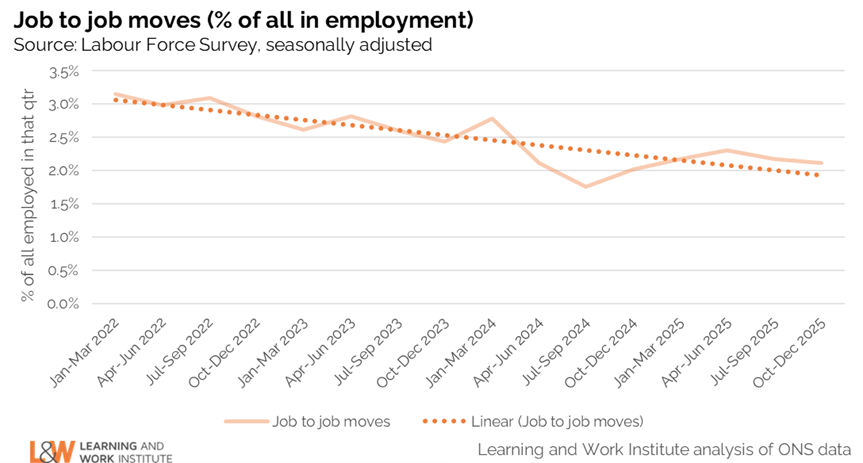
This both reflects and reinforces the lack of opportunity we can see in the vacancy data: people are not moving jobs because there are insufficient vacancies for them to go into, which in turn reduces opportunities for new entrants as people stick with their existing jobs.
Where are the issues?
There are 122,000 fewer people working in hospitality and retail than there were a year ago
The PAYE data tells us where the biggest hits have been to the labour market: retail and hospitality. The number of people working in these sectors has fallen by 2.6% (hospitality) and 1.5% (retail) over the last year (comparing January 2025 with January 2026).
Between them, these sectors account for over half of the gross decline in jobs across shrinking sectors in this period. While some sectors have seen increases in workers – notably the public sector (particularly health and social work) – this has not been enough to counteract falls elsewhere.
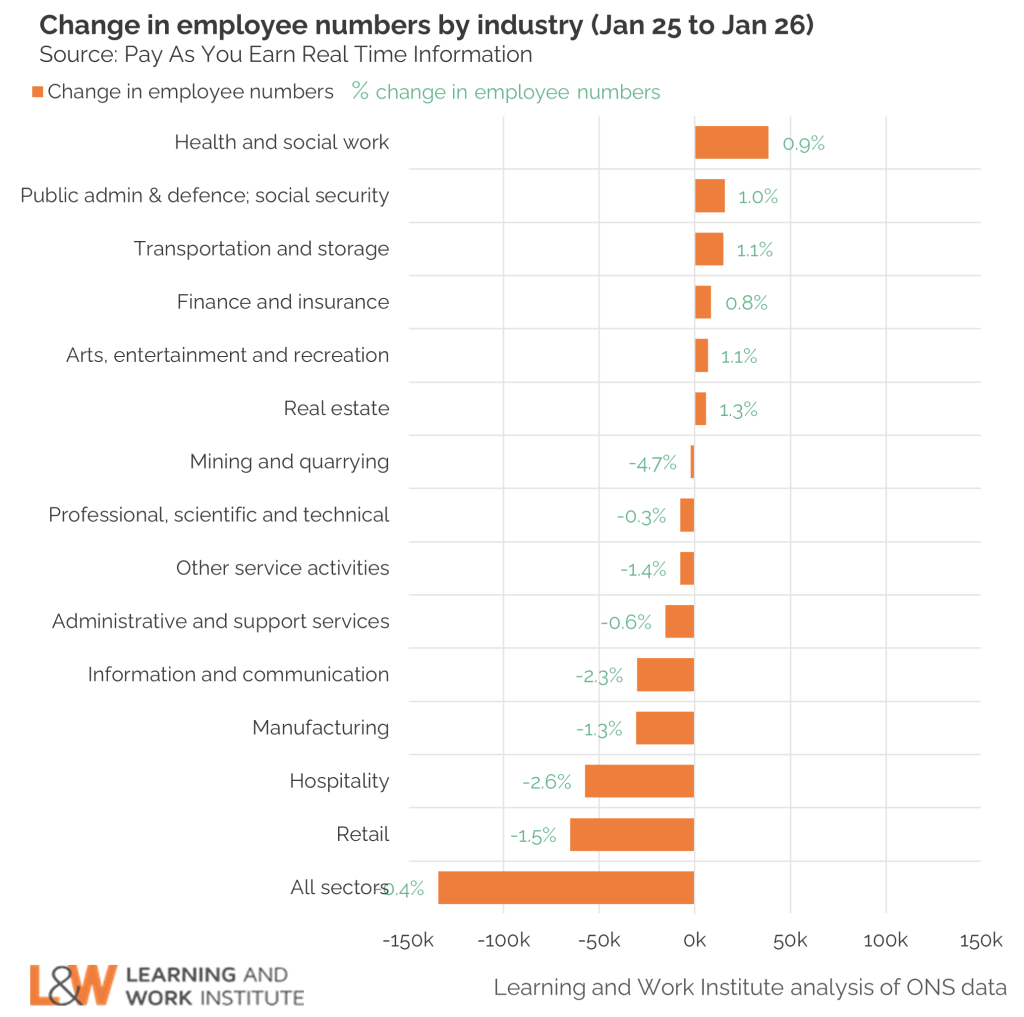
This is another key part of the youth employment challenge. Retail and hospitality are the sectors where many of us took our first steps into the jobs market. With opportunities in these sectors declining, there are real questions about where young people may get their first experiences of the world of work.
Unemployment is growing unevenly across the country
The headline unemployment rate change masks significant differences across the country. The unemployment rate is highest in London – a place with large retail and hospitality sectors. London’s employment rate is 7.6%, up 1.5 ppts points on the previous year (Oct-Dec 2024). The highest increase over this period has been in the East Midlands and the North East, which both experienced a 2.0 ppt rise in unemployment. The current unemployment rate in the East Midlands is 6.0%, compared with 7.0% in the North East. Meanwhile, unemployment has fallen over the past year in Wales – although the overall employment rate in Wales remains lower than England as a whole.

Who is at risk?
The youth (18-24) unemployment rate is now at 14.0%, and 1.26 million 16-24s are NEET
Any sign of a hiring slowdown is bad news for people trying to enter the labour market for the first time and is therefore bad news for the Government’s push to tackle youth unemployment.
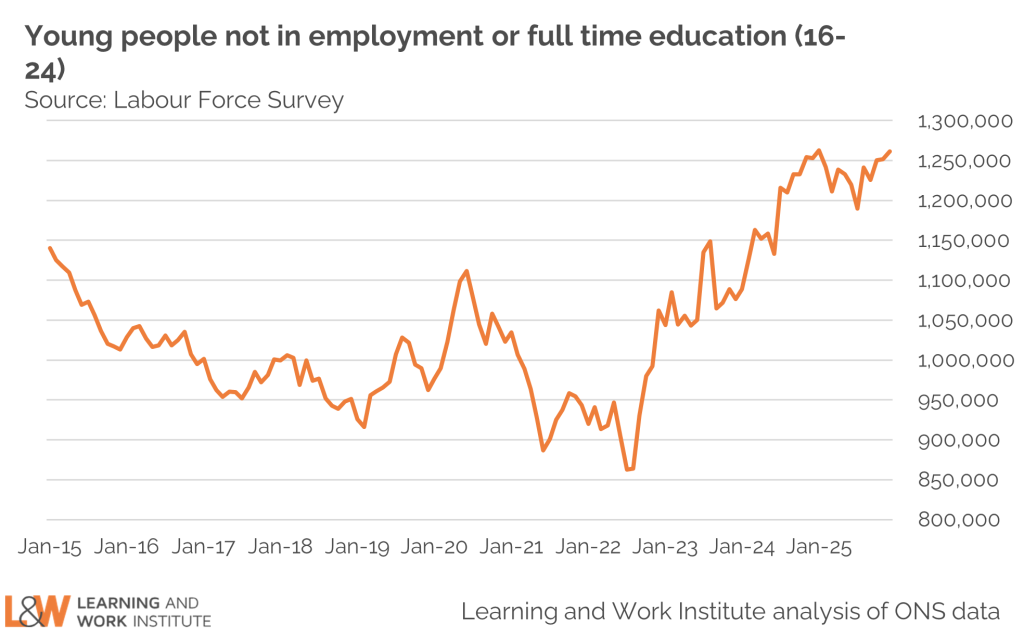
This is a stubbornly persistent issue. The number of people age 16-24 who are NEET (not in employment or full-time education) is now 1.26 million – back to the peak reached at the start of 2025. Unemployment among 18-24 year olds is at 14.0% – 1.4 ppts higher than the previous quarter.
The disability employment gap remains broadly stable
The other group that the Government is particularly concerned about is people with long-term health conditions. This quarter, we have updated information on the employment status of disabled people (which here means people with conditions and/or illnesses that limit their ability to carry out day-to-day activities, and which are expected to last 12 months or more).
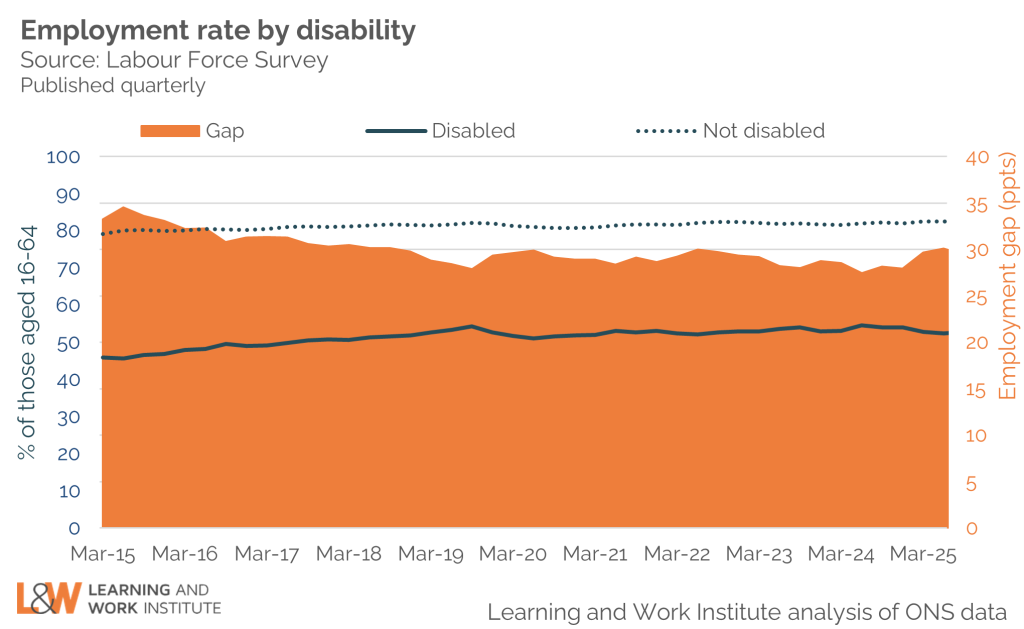
The pandemic arrested years of decline in the disability employment gap. Since then, the employment rate gap between disabled and non-disabled people has stabilised at around 29 ppts. In the most recent quarter (Oct-Dec 2025) the gap was fairly similar to that seen in the previous quartery: the employment rate among disabled people was 52.3% in Jul-Sep 2025 and 52.8% in Oct-Dec 2025, while the employment rate among non-disabled people was almost unchanged 82.5% in Jul-Sep 2025 and 85.3% in Oct-Dec 2025.
Employment gaps between people from different ethnic backgrounds remain high, but not worsening
The latest quarterly employment data also breaks down employment by ethnic group – which we use to calculate the employment gap between people from ethnic minority groups and the majority ‘White’ ethnic group. Broadly speaking, there is little change – with people from Pakistani and Bangladeshi groups continuing to face comparatively low levels of employment. The most notably change is perhaps among people from an Indian background who – for the last two years – have experienced higher employment rates than the White group.
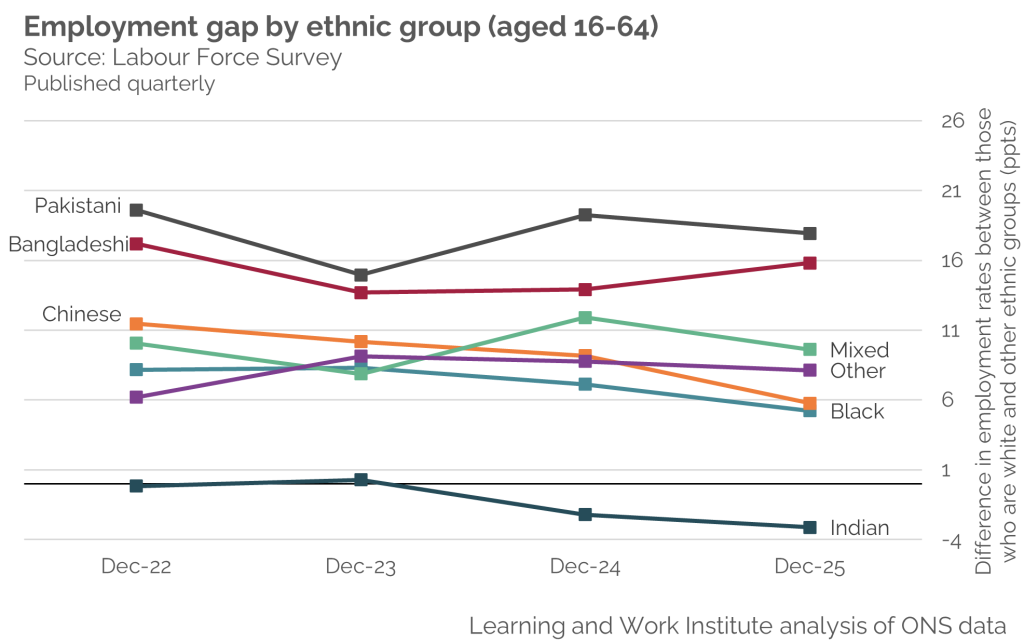
There are many factors at play underlying these data – with heterogenous experiences of structural racism, immigration, socio-economic background and geography all coming into play. We are currently working up a new project with partners specifically digging into the intersectional experiences of Disabled people from ethnic minority backgrounds, and what that means for the ‘health and work’ agenda.
Wage growth is slowing – making interest rate cuts more likely
Real average weekly earnings are now (as of December 2025) at £527 – £2 a week less than the same time last year and £265 less than they would have been if earning growth had continued to follow the pre-financial crisis trend.
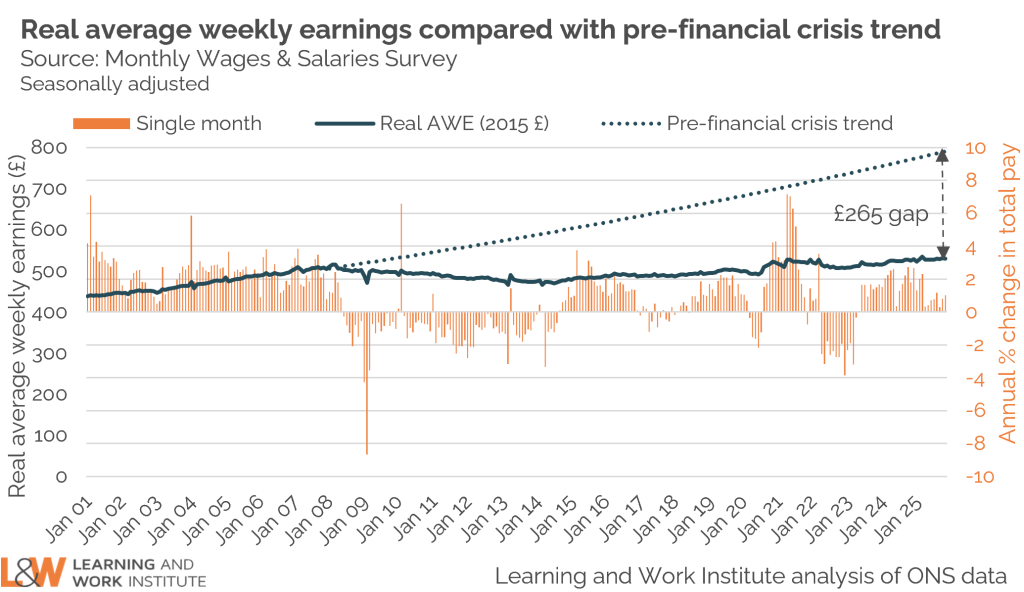
Slowing wage growth is one of the stories that has been picked out by commentators today – with many predicting that it will prompt an interest rate cut this Spring. For our purposes, the key point is that slowing wage growth – particularly in the private sector (where growth in regular pay was 3.4% in Oct-Dec 2025, compared with 7.2% in the public sector) is a further sign of a cooling labour market. The slowing of both hiring and pay increases do not suggest that the UK will be awash with opportunity for job seekers any time soon.
Can we trust this data?
Our headline indicators are based on data from the Labour Force Survey, but since the pandemic this has experienced a decline in the response rate which affects the reliability of estimates from this source. This is illustrated by the divergence in the employment rate estimated from the LFS and other sources over this period. While the ONS seeks to resolve these issues, we are publishing an experimental estimate of the employment rate based on an approach developed by the Resolution Foundation and using administrative data sources, such as HM Revenue and Customs payroll and self-assessment data on the numbers of people self-employed.
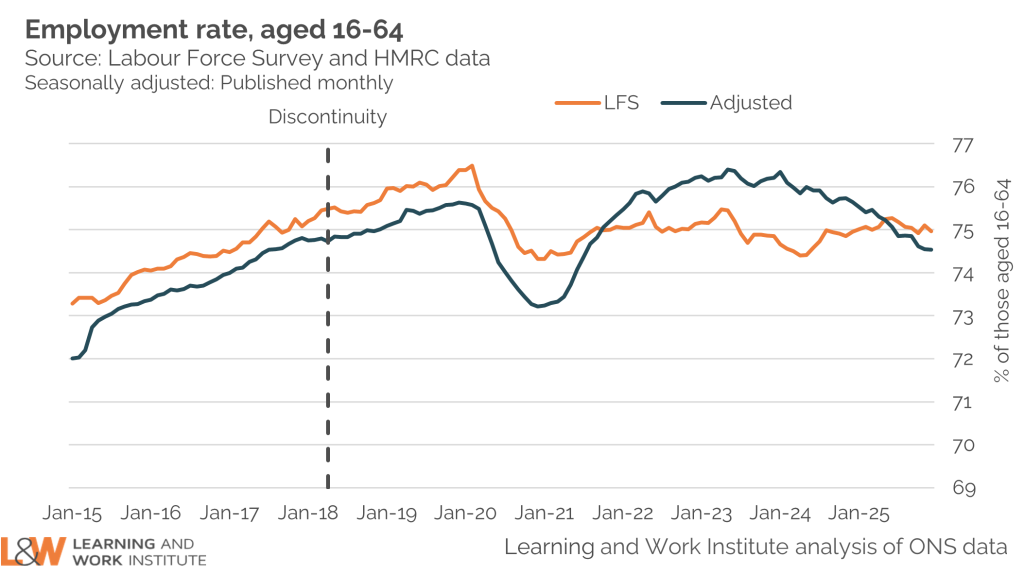
The divergence is substantially less stark than it was – suggesting that the LFS is becoming more accurate. However, while the short-term trends may now be starting to align in the two data sources, the adjusted data series points to a much sharper decline in employment rates over the last year (from a higher starting point) – further evidence of a cooling labour market, and confirmation of the headache this Government faces.