Labour Market Briefing: May 2026
Every month, Learning and Work Institute produces detailed and timely analysis of the latest labour market statistics from ONS. We examine what the figures tell us both about the health of our labour market, and what they mean for people’s experiences of work, with a particular focus on groups facing labour market disadvantage. Become a supporter to receive our monthly briefing delivered directly to your inbox and navigate our labour market dashboard.
May 2026
Stephen Evans, Chief Executive at Learning and Work Institute, said:
The labour market remained flat heading into the current international crisis, with employment, vacancies and other measures all flat or worsening. If the crisis persists, this risks being the calm before the storm. Real regular pay fell in the private sector as inflation started to rise and over 640,000 fewer people are in work six years on than if the employment rate had stayed at its pre-pandemic level. The UK employment rate is still higher than many other countries, but 3.9m people are out of work and say they want a job.
We know that the war on Iran is having an impact on UK businesses and workers already – inflation is up (due largely to rising fuel costs), eroding real wages. That may well lead to further issues in an already stagnant UK labour market, with the ongoing uncertainty likely to create caution among UK employers at best, and cutbacks at worst.
But today’s data – which largely takes us up to March this year – is still too early to tell us how this will play out. Instead, what we have today is a picture of the labour market before these issues hit.
The picture is one of stagnation – employment is at the same level as it was a year ago, and still below pre-pandemic levels. Competition for jobs appears to be rising, with 5.5 out-of-work people wanting a job for every vacancy. People facing barriers to work are finding it harder than they were a year ago: with employment rates for people with a disability down, and the number of NEET young people continuing to soar. Employment growth is being bolstered by the public sector, but employment and vacancies are down in most industries.
All in all, what we can see here is a labour market that is not in crisis – but also not delivering growth and opportunities. Do you think we’re missing any sunlit uplands, or clear warning signs? Let us know (Emily.Andrews@learningandwork.org.uk)
Employment is neither falling nor rising
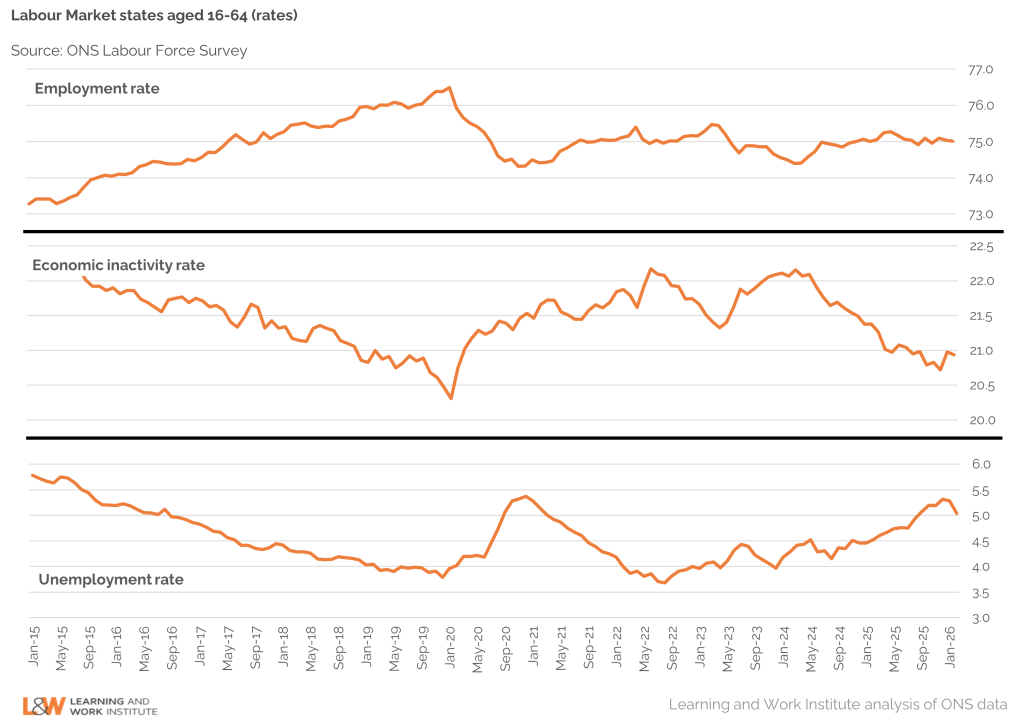
The headline labour market stats from the Labour Force Survey for Jan-Mar 2026 are all essentially flat: employment is at 75% (as it was in the previous quarter), unemployment is at 5.1% (a 0.2 ppt drop) and economic inactivity is at 20.9%, virtually unchanged on the previous quarter.
This is also broadly where we were a year ago, but well below where we were pre-pandemic. If employment rates now were where they were in February 2020, another 640,000 people would be in work.
The job market is getting more competitive: there are 5.5 people out of work and wanting a job for every vacancy
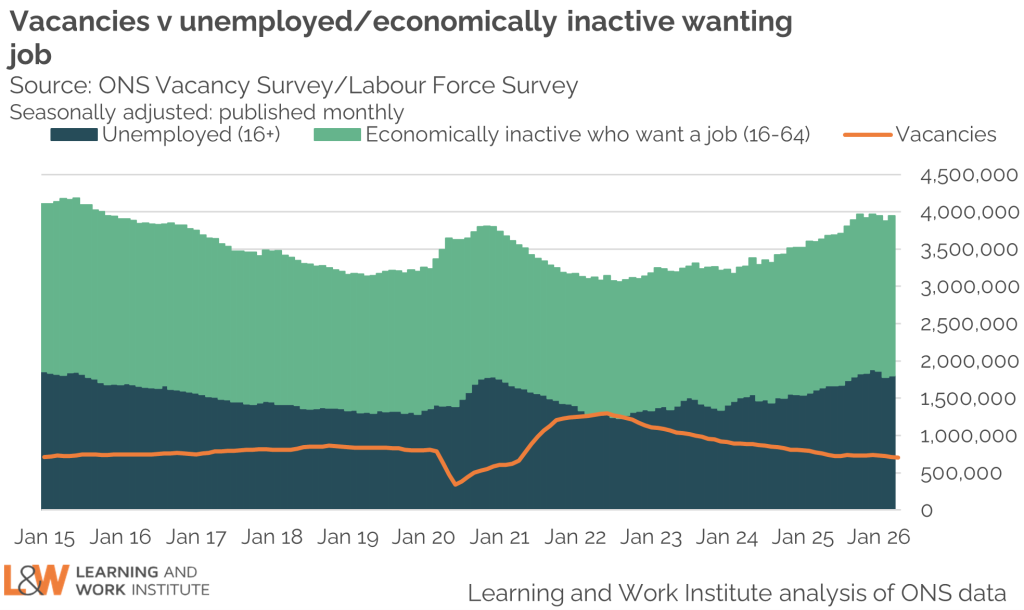
It appears that that the labour market has been getting slowly more competitive over the last year, with more than 5.5 people out of work (but wanting a job) for every vacancy in March, up from 4.6 a year ago.
This squeeze has come from both directions, but the big story is falling vacancies: there were 63,000 fewer vacancies in March 2026 than in March 2025.
‘Underemployment’ and ‘overemployment’ are both trending up
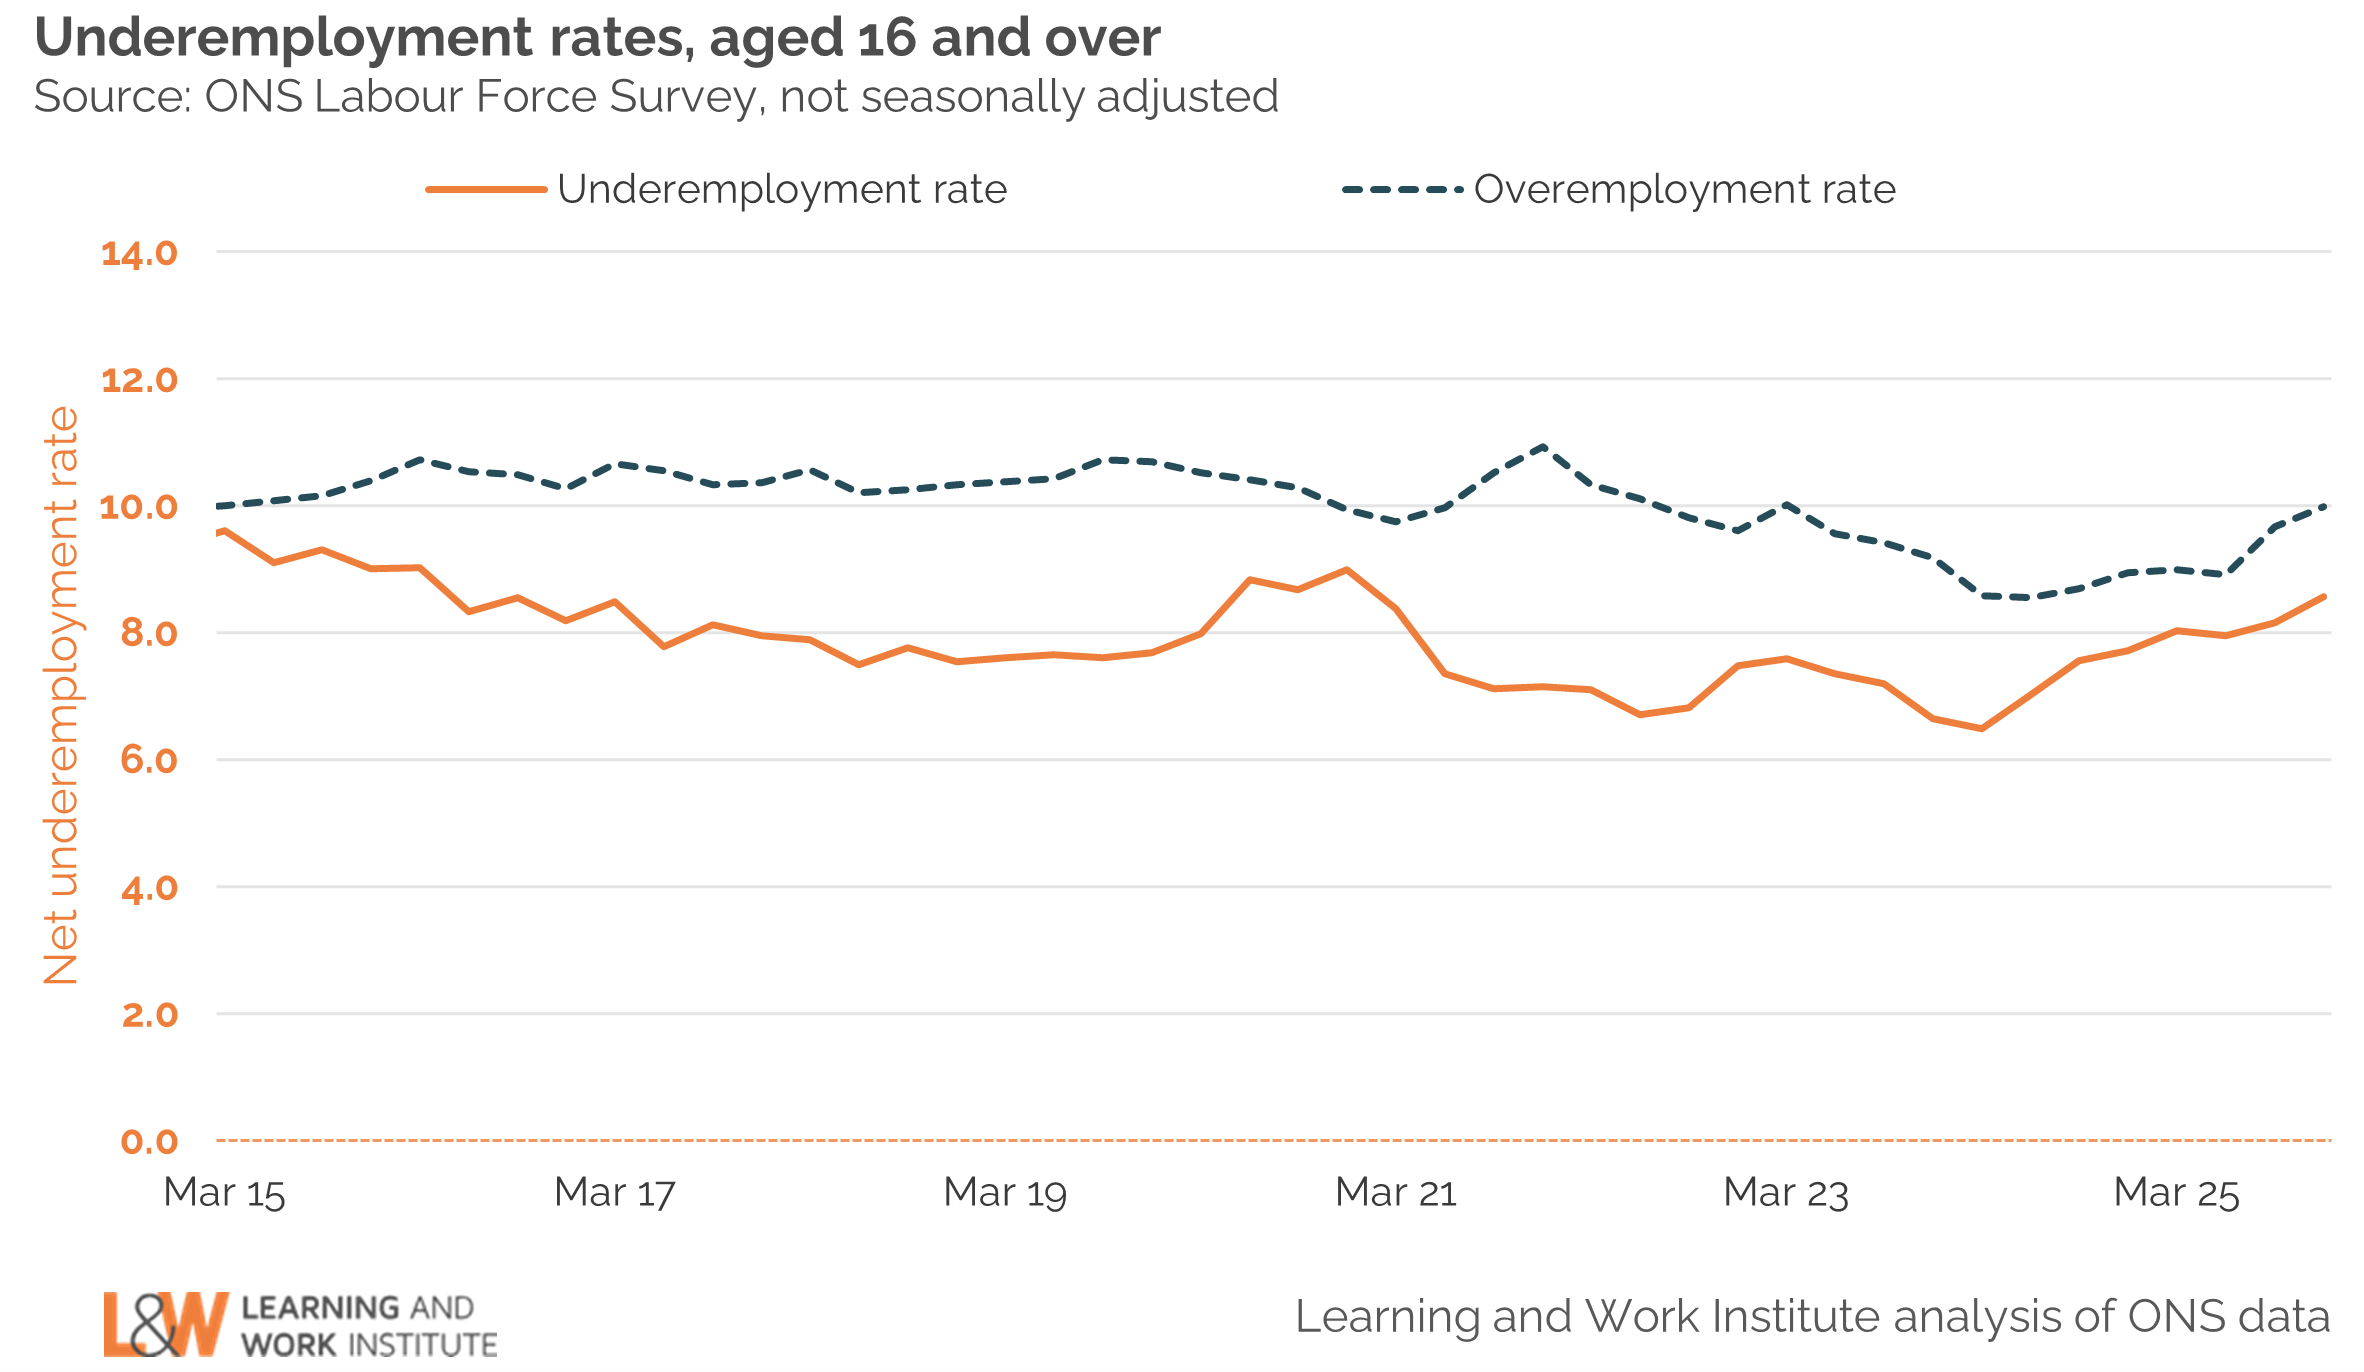
In a struggling labour market, you would expect to see under-employment (people wanting more hours of work) rising, and overemployment (people wanting fewer hours) falling.
That’s not quite what is happening – under-employment has risen over the past year, but so too has overemployment. This doesn’t point to a struggling labour market necessarily, but a dysfunctional one – one which can’t match the needs of workers and employers. This is a problem for individuals – who are not getting the opportunities from the jobs market that they want and need – and a bad sign for our economy, that’s not able to make the most of the workers it has.
The disability employment gap has risen
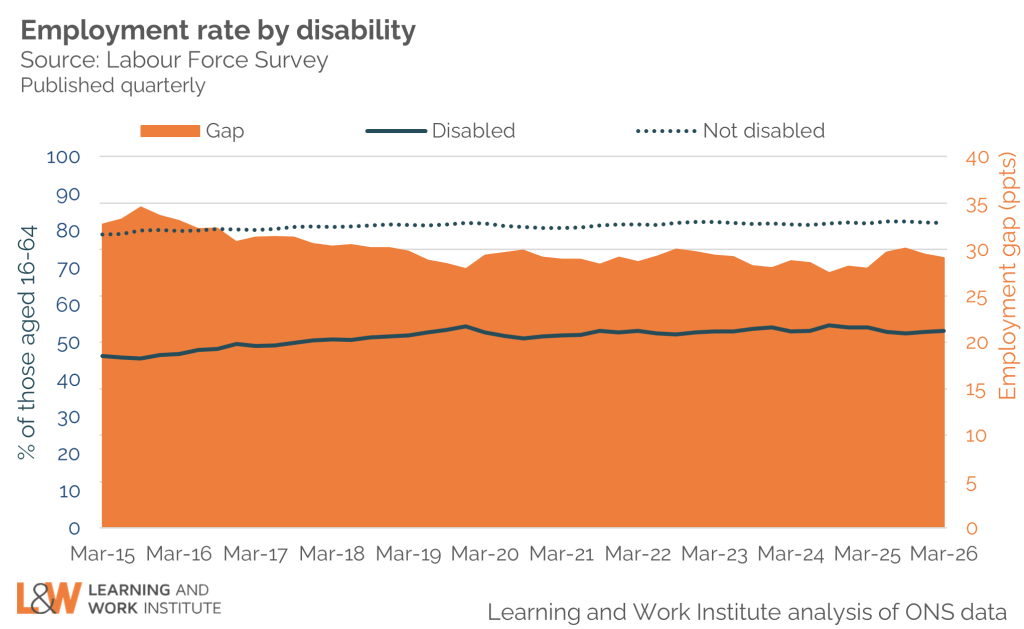
One group that we know is not getting the opportunities they want and need is people with a disability – a group that is particularly likely to face underemployment, if there are no jobs available that are accessible to them.
Despite substantial policy and public attention to this issue, today’s data does not bring good news. The disability employment rate has fallen – now at 53%, compared with 54% a year ago – while the rate for people without a disability has remained stable.
The Government’s initiatives to tackle this issue over the last two years, will of course take a while to translate into national-level changes. But a stubbornly high disability employment gap is precisely what the Government does not want to see in the run up to the Timms review, when further announcements are set to be made on reforms to disability benefits – predicated in part on these recent initiatives bearing fruit.

The number of people not in employment or education continues its sharp rise
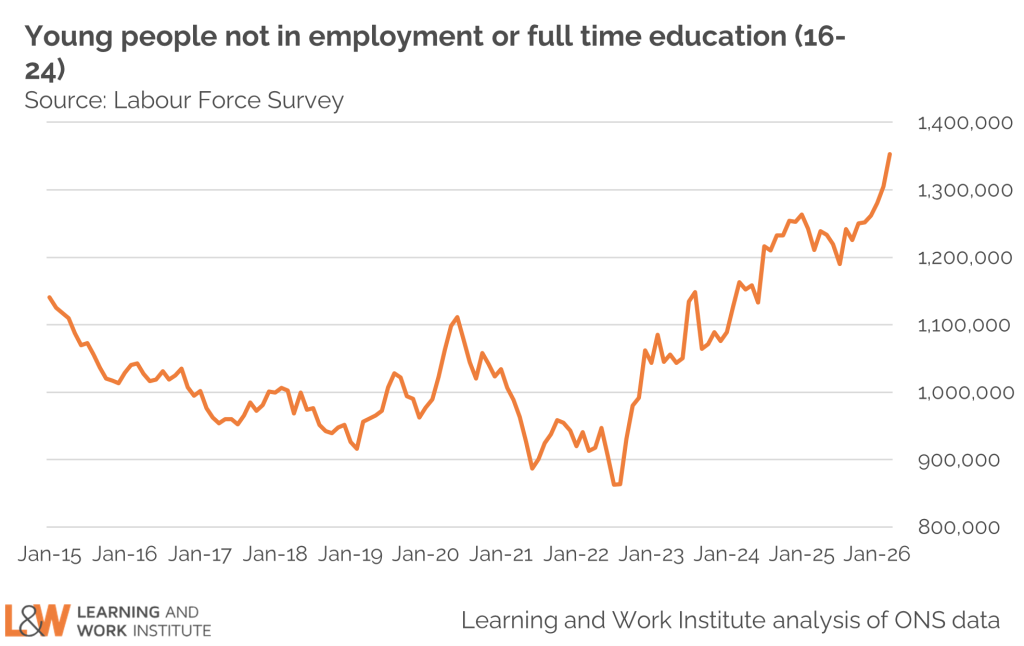
Young people are the other group most obviously hit by the constrained labour market. This quarter saw another sharp up-tick in the number of NEET young people: there are now 1.35 million young people not in employment or full-time education, up from 1.26m in the previous quarter and 1.21 a year ago.
We are soon expecting the report of the Milburn Review of young people at work – although this is deliberately taking a long-term view (trying to understand the ‘root causes’) of this phenomenon, rather than seeking short-term solutions. Those have already been rolled out via the Government’s substantial ‘Youth Guarantee’ programme of employment support – from which DWP will hope to start seeing results over the next year or so.
Industry data highlights particular challenges in the private sector – although vacancies are not showing strong growth anywhere
Our sectoral charts rely on data from HMRC’s PAYE system – which is notoriously unreliable at the end of the financial year (data for April are generally subject to large revisions in subsequent releases). For that reason, we take the apparent large fall in payroll employment – supposedly down by 100,000 between March and April– with a pinch of salt. But broadly, the sectoral picture remains consistent with what we have been seeing in recent releases.
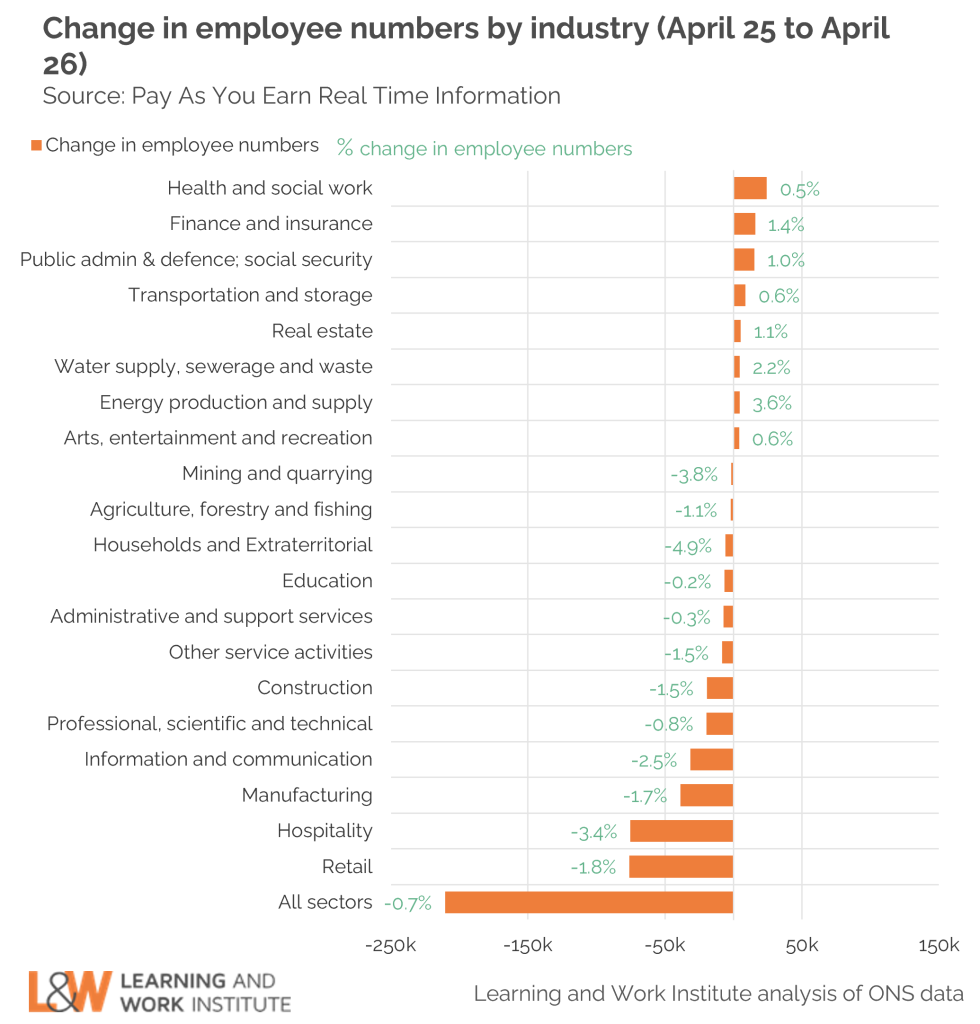
That means we continue to see notable differences between the public and private sectors. Public sector employment represents about 18% of the total UK workforce, but almost half of all employment growth in the last year came from ‘health and social work’ and ‘public administration and defence’. That strong growth in health and social work may be slowing: employment in this sector was up 0.5% in the year to April 2025 (compared to a 0.8% rise in the year to March), and vacancies are down 6.3% in the previous year.
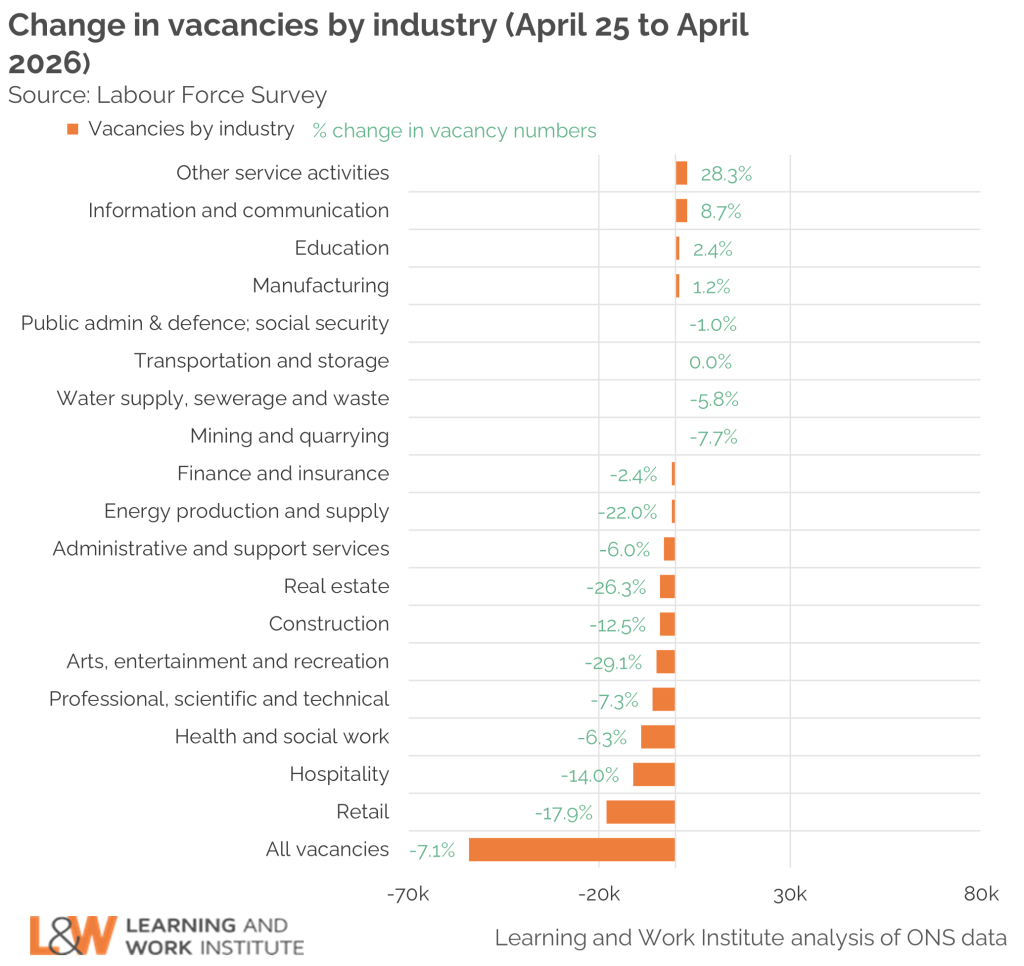
Retail and hospitality – which combined make up 20% of all UK employment – continue to contract. Employment is down in these sectors by 2% and 3% respectively over the past year, with an 18% and 14%% fall in vacancies– throttling access to these often flexible and entry-level jobs.
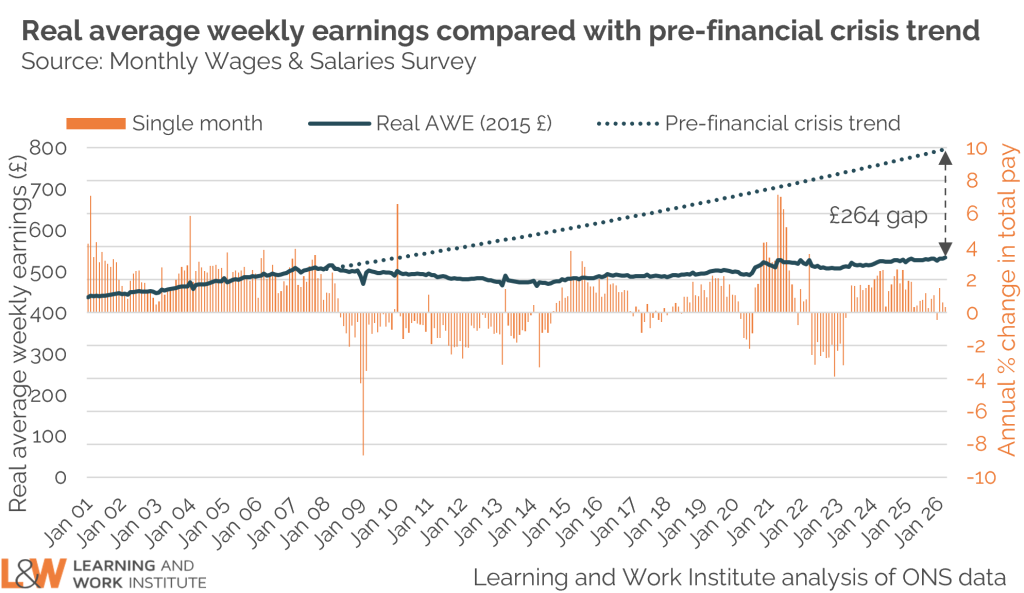
Real wage growth has ground to a halt
Nominal wage growth in the public sector (4.8%) continues to outstrip the private sector (3%), with the latter essentially eroded to nothing in real terms by rising inflation over the same period. Earnings growth has stagnated since the global financial crisis, leaving the average employee around £12,000 a year worse off than if the pre-crisis trend has continued. Although many employees in the public and private sectors experienced real-wage growth from mid-2023 onwards, the rising cost of living as a result of disruptions to fuel supply mean this is no longer the case.
19 May 2026
Labour Market Briefing: May 2026
Our analysis of the ONS labour market statistics, released on the morning of 19 May 2026.
19 May 2026
Labour market dashboard
Every month, Learning and Work Institute produces detailed and timely analysis of the latest labour market statistics from ONS. Explore our interactive charts.
19 May 2026
Labour market stats response, May 2026
L&W's chief executive Stephen Evans responds to the latest labour market data from ONS.
21 April 2026
Labour Market Briefing: April 2026
Our analysis of the ONS labour market statistics, released on the morning of 21 April 2026.
21 April 2026
Labour market stats response, April 2026
L&W's chief economist Dr Helen Gray responds to the latest labour market data from ONS.
19 March 2026
Labour Market Briefing: March 2026
Our analysis of the ONS labour market statistics, released on the morning of 19 March 2026.
19 March 2026
Labour market stats response, March 2026
L&W's chief executive Stephen Evans responds to the latest labour market data from ONS.
17 February 2026
Labour Market Briefing: February 2026
Our analysis of the ONS labour market statistics, released on the morning of 17 February 2026.
17 February 2026
Labour market stats response, February 2026
L&W's chief executive Stephen Evans responds to the latest labour market data from ONS.
20 January 2026
Labour Market Briefing: January 2026
Our analysis of the ONS labour market statistics, released on the morning of 20 January 2026.