

Every month, Learning and Work Institute produces detailed and timely analysis of the latest labour market statistics from ONS. We examine what the figures tell us both about the health of our labour market, and what they mean for people’s experiences of work, with a particular focus on groups facing labour market disadvantage. Become a supporter to receive our monthly briefing delivered directly to your inbox and navigate our labour market dashboard.
April 2026
Dr Helen Gray, Chief Economist at Learning and Work Institute, said:
This month’s labour market statistics are a tale of two sectors, with regular pay in the public sector increasing by 5.2 per cent over the past year, compared with private sector annual wage growth of 3.2 per cent over the same period. With inflation at 3.2 per cent in the year to February, wage increases are only just keeping up with price rises in the private sector. As the Iran war continues to contribute to inflationary pressures for employees and employers alike, the prospects for job opportunities in general and the standard of living for those in the private sector in particular look increasingly concerning.
Tough times ahead for jobseekers and private sector employees in particular
Although there are no major changes in the key labour market indicators this month, there are early signs of trouble ahead. Vacancies are down in most sectors and employment is contracting in much of the private sector. Redundancies are on the rise, and since the end of 2025, employers have been consulting over an increasing number of redundancies. On average, wages for 28 million private sector employees are now only just keeping pace with inflation and the Iran war looks certain to increase cost of living pressures for everyone over the coming months.
It’s an especially difficult time for the 3.9 million people who are out of work and wanting a job, facing a labour market where they outnumber vacancies by more than 5 to 1. And the 1.3 million young people not in full-time education or employment are at a particular disadvantage – evident from the signs of rising long-term unemployment for this group. We continue to explore potential solutions to these problems through our work evaluating the JobsPlus pilots – a scheme offering localised employment support to anyone who needs it, including young people who are not claiming benefits.
This month it’s my turn, as Chief Economist, to present my take on the state of the labour market with the help of a few charts to illustrate the main headlines.
Next month I’ll be handing the reigns back to our Director of Research and Policy, Dr Emily Andrews. Do please get in touch with her by emailing Emily.Andrews@learningandwork.org.uk if you have suggestions on how we can make this briefing better, or more useful.
The context
Still no big changes in the headline employment stats
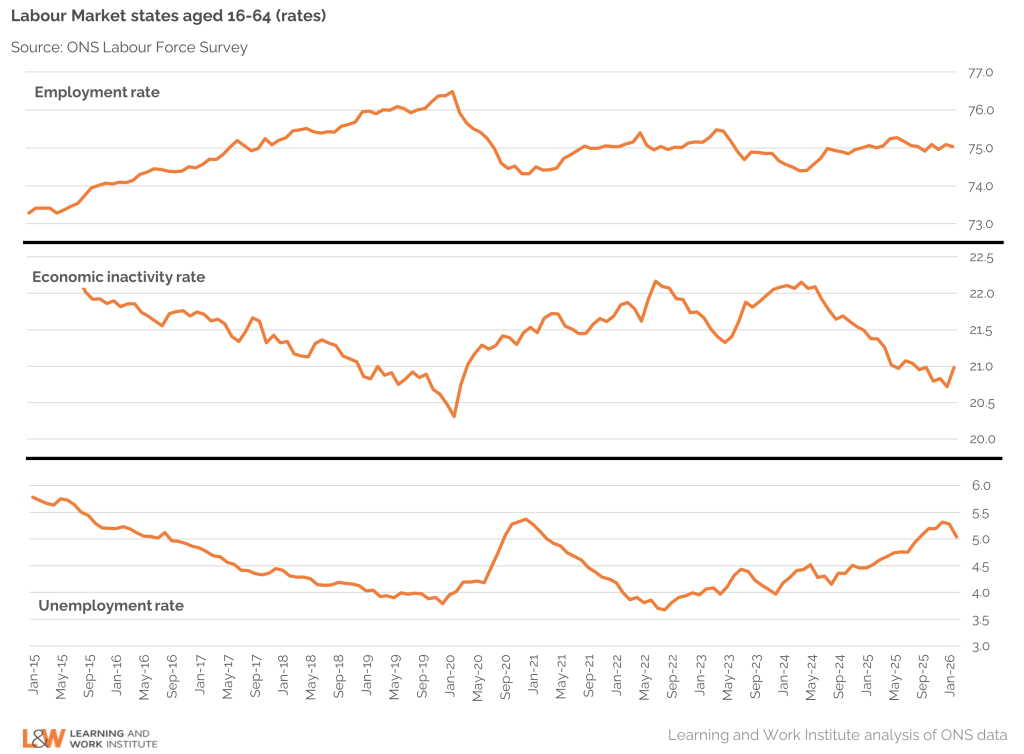
The slight fall in unemployment in this month’s labour market figures has attracted attention for going against the recent upward trend, but in any meaningful sense the labour market remains basically flat. For those aged 16-64, the unemployment rate stood at 5.0% in the December 2025 to February 2026 quarter, very slightly down on 5.2% in the previous quarter. It remains to be seen what impact the start of the Iran war at the very end of February might have on the labour market in future months. For now, the employment rate is 75.0% – virtually unchanged on the previous quarter (when it stood at 75.1%), while the rate of economic inactivity is very slightly up, at 21.0% compared with 20.8% in the September to November quarter of 2025.
There are 5.4 out-of-work people looking for a job for each vacancy: nearly 1 more person chasing every vacancy than a year ago
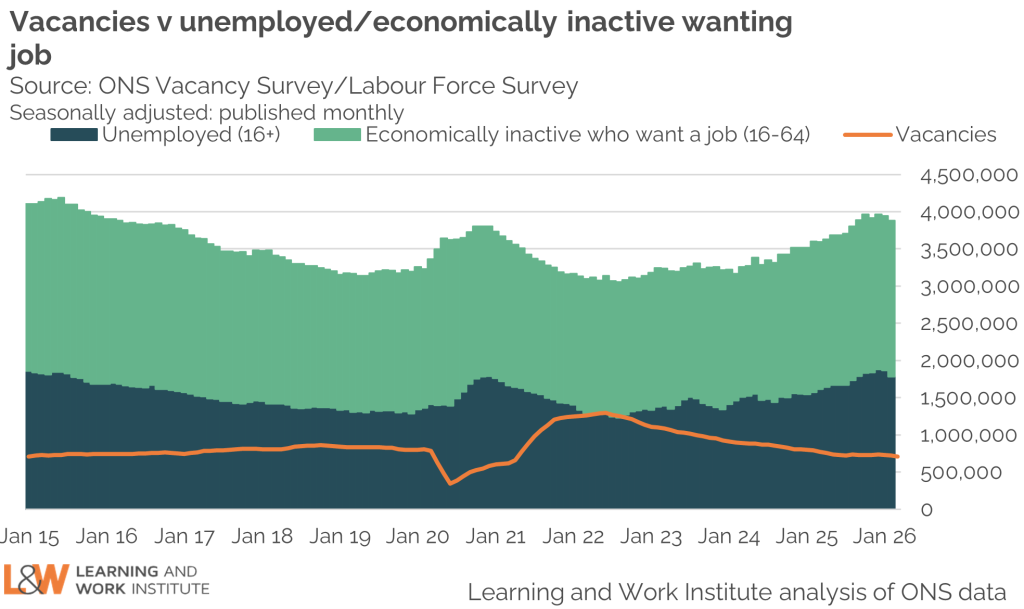
There are currently 5.4 people who are out of work and want a job for every vacancy, compared with 4.5 a year ago. There were 72,000 fewer vacancies in February 2026 than a year earlier, while the numbers unemployed have risen by 206,000 and the number of people who are economically inactive who want a job has risen by 70,500. The slew of recent forecasts, from the Organisation for Economic Co-operation and Development, the International Monetary Fund and the EY ITEM Club, downgrading growth projections suggest this pattern of employers cutting back on hiring while more people seek work is only likely to get worse.
The youth challenge
There are 1.31 million young people not in employment or full-time education.
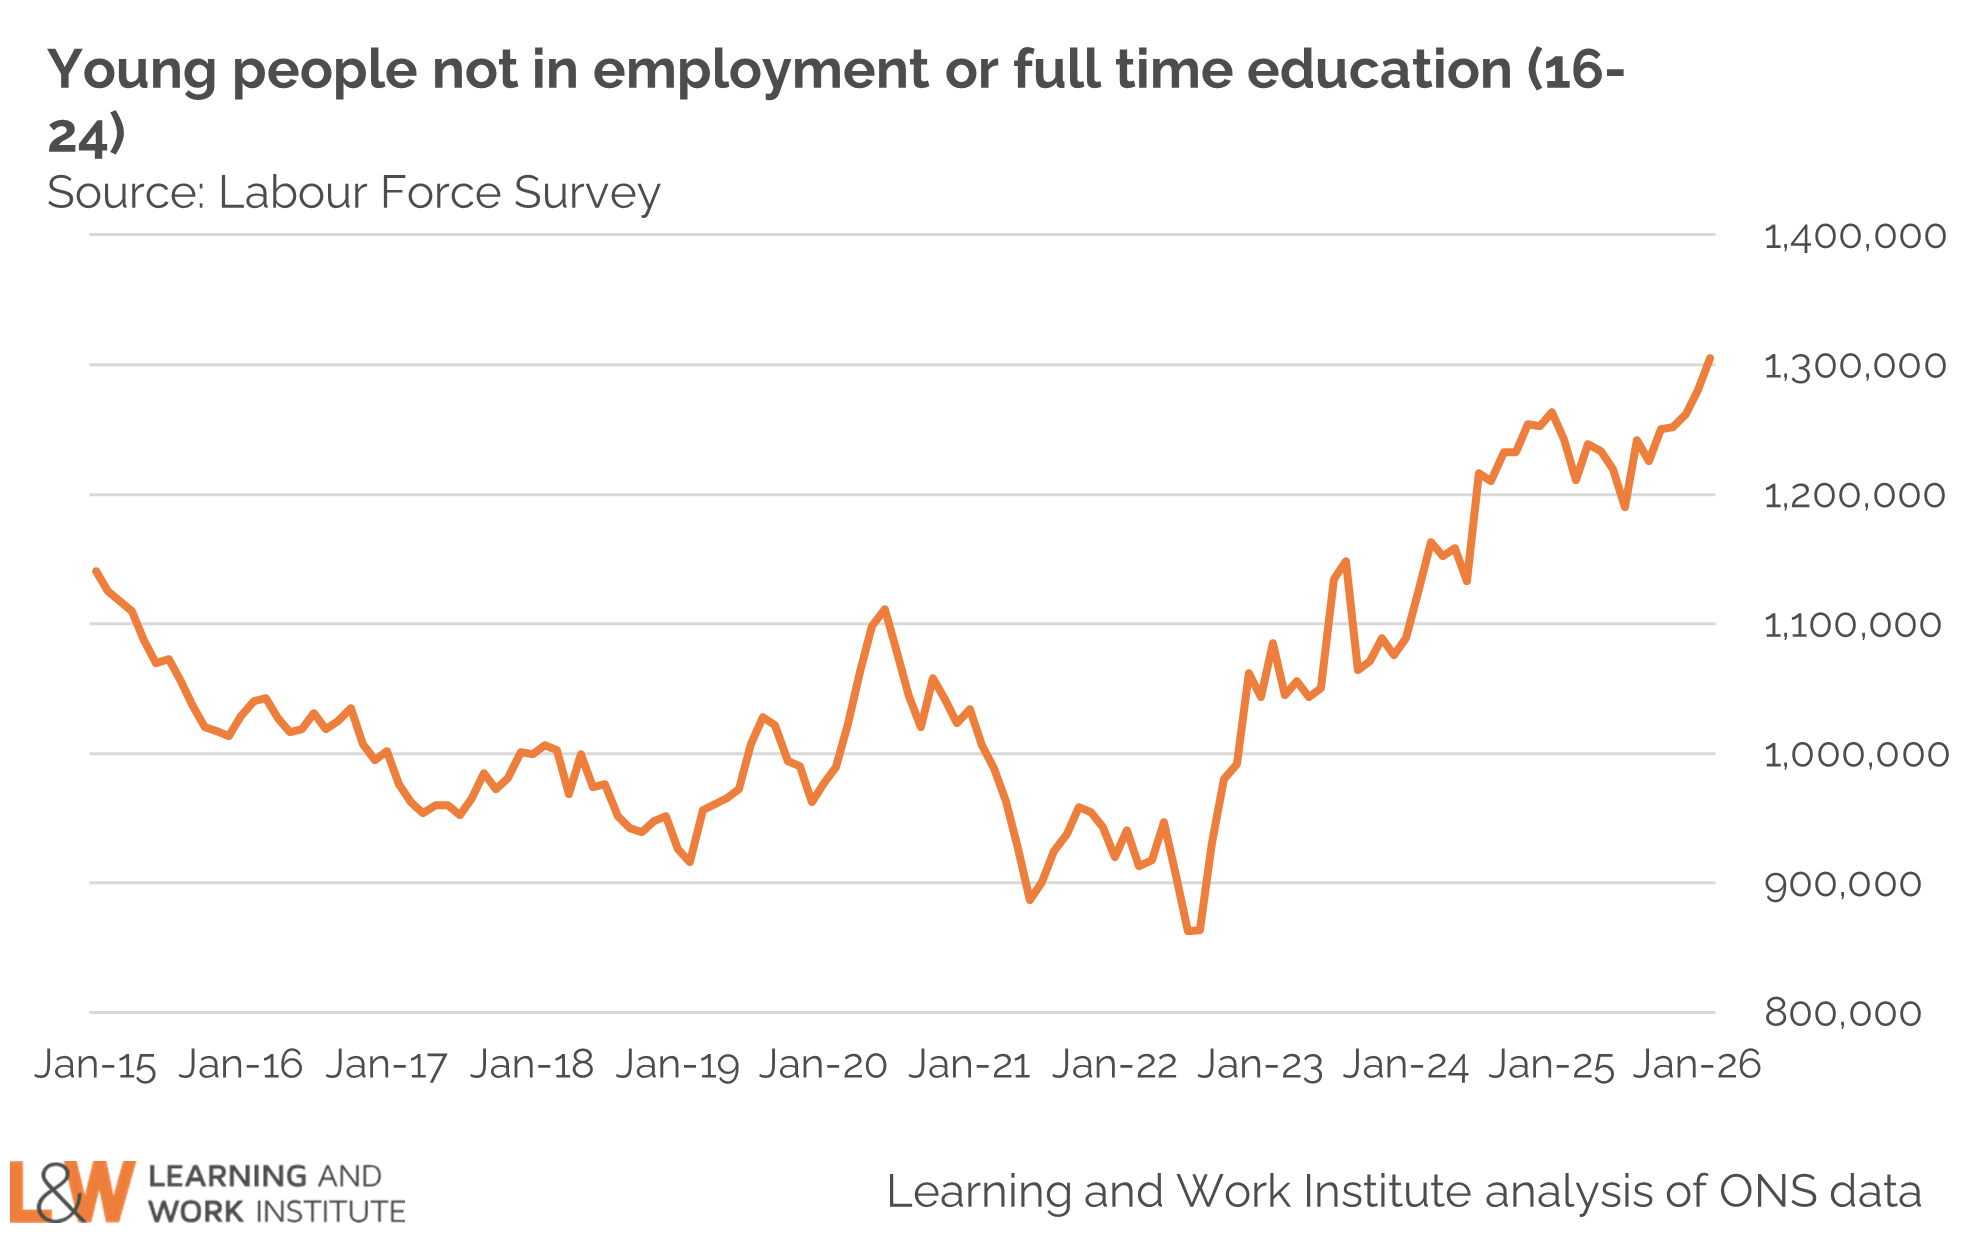
The number of young people not in employment or full-time education has risen by 63,000 over the past year and the youth unemployment rate increased from 14.6% in the December 2024 to February 2025 quarter to 15.8% in the same quarter one year later. More worrying, the numbers of young people unemployed for 6 months or more has risen by 67,000 over the past year. It will be some time before it becomes apparent whether the Government’s recently announced Jobs Guarantee scheme, offering subsidised 6-month placements for long-term unemployed young people, can reverse this trend.
Job opportunities
Employment growth largely concentrated in the public sector, with big contractions in vacancies in Construction and Retail in particular
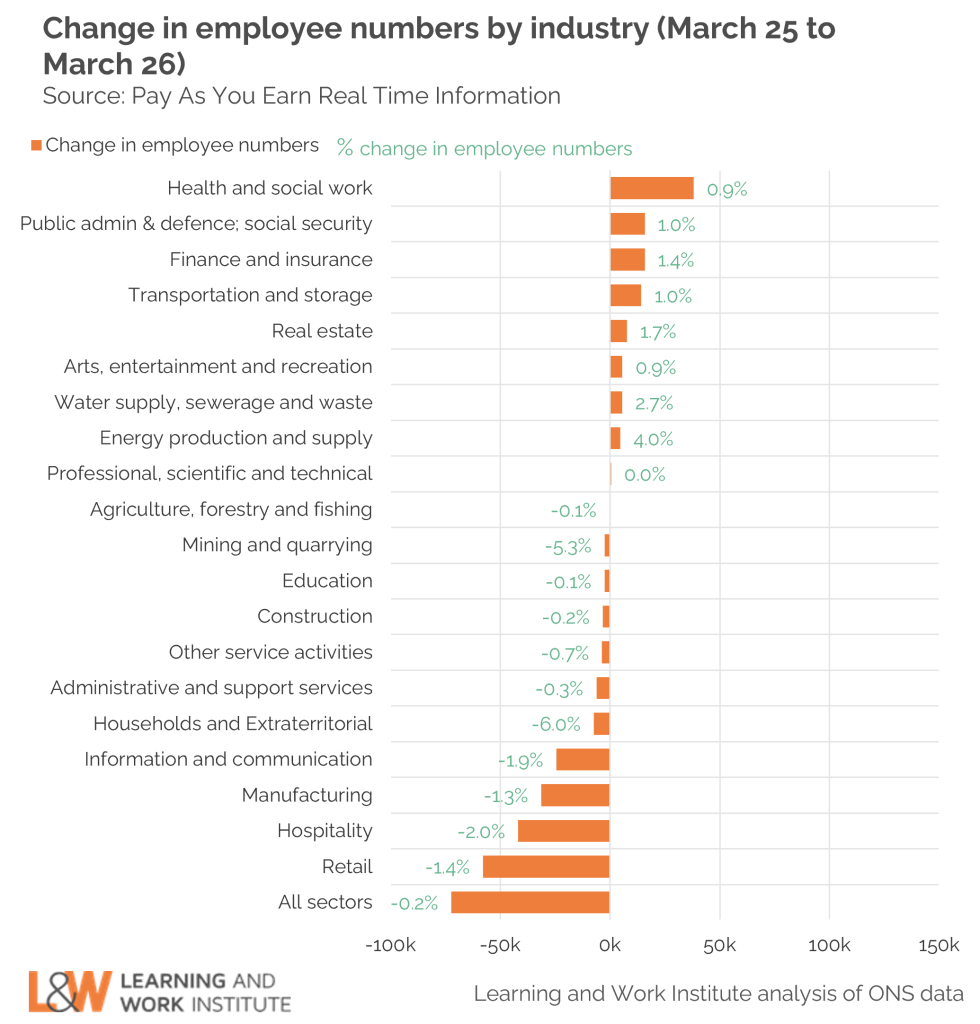
The contrasting fortunes of the public and private sectors are evident in latest data on employment. The Health and social work sector experienced the greatest increase in the number of employees between March 2025 and March 2026, followed by Public administration and defence and social security – both dominated by public sector employees. By contrast private sector employers in Retail and Hospitality saw the biggest workforce reductions over this same period, starkly illustrating the differing circumstances in the public and private sectors at present.

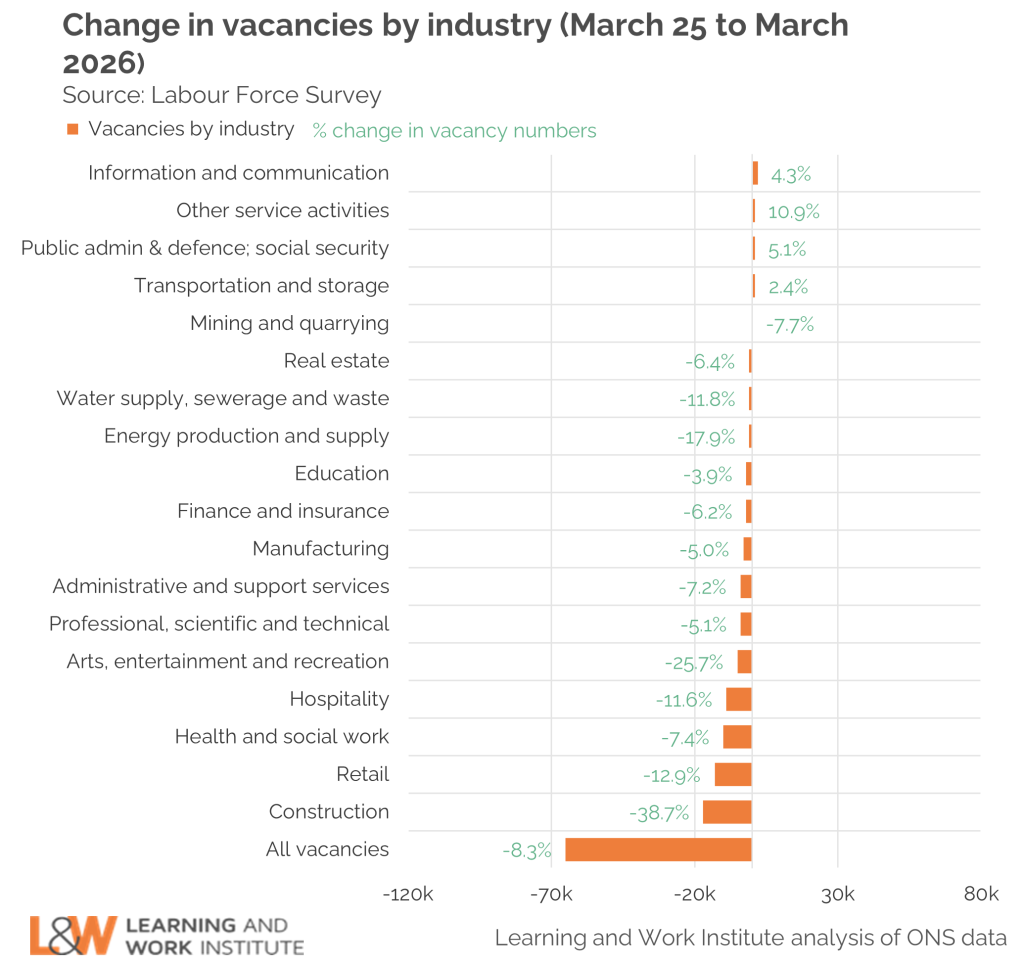
While the Health and social care workforce has grown over the past year, Public administration, defence and social security is the only industry predominantly in the public sector to have experienced growth in the number of vacancies (and then only an increase of 1,000 advertised posts compared with the January to March quarter of 2025). The Education and Health and social work sectors are advertising fewer vacancies now than a year ago and the impact of public sector spending cuts are also apparent in the chunky 25.7% reduction in vacancies in the Arts entertainment and recreation industry. However, overall the scale of reductions in vacancies in the public sector is way below the cuts seen in some industries dominated by private sector employers. For example, vacancies in the Construction industry – a bellwether for the state of the economy – fell by a staggering 38.7% in the year to March 2026. In Retail – responsible for the largest share of private sector employees – vacancies fell by 12.9%.
At the other end of the employment spectrum, redundancies are up by 19,000 on a year ago, while the number of redundancies employers are consulting over has averaged 26,600 a month in the past three months, compared with an average of 25,100 a month in the final quarter of 2025. This points to difficult times ahead for current employees, as well as those seeking work.
The pay challenge
Private sector wages no longer increasing in real terms
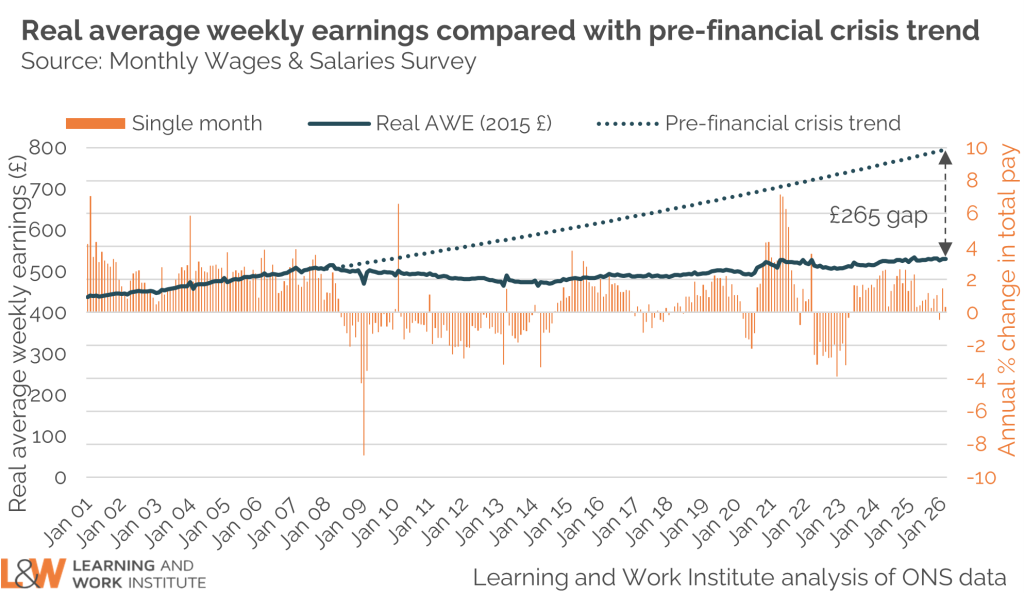
On average, public sector pay grew by 5.2% in the year to February 2026. By contrast, regular pay in the private sector increased by 3.2%, equalling the rate of inflation in February. This does not bode well for private sector employees faced with likely rises in the cost of living as the impact of disruption in the Strait of Hormuz becomes apparent. And of course, as nominal increases in regular pay are an average, some employees will have seen their wages falling in real terms over the past year.
Taking a longer view, since the financial crisis of 2008, employees have experienced a reduction in their wages of £265 a week compared with the upward trend seen before this point. In the context of current job cuts and reductions in hiring in many sectors, it seems increasingly unlikely that the gap between current wages and the pre-financial crisis trend will close any time soon.
Regional differences
Employment rates have risen in Wales and the North East of England over the past year, but have fallen in the South West and North West
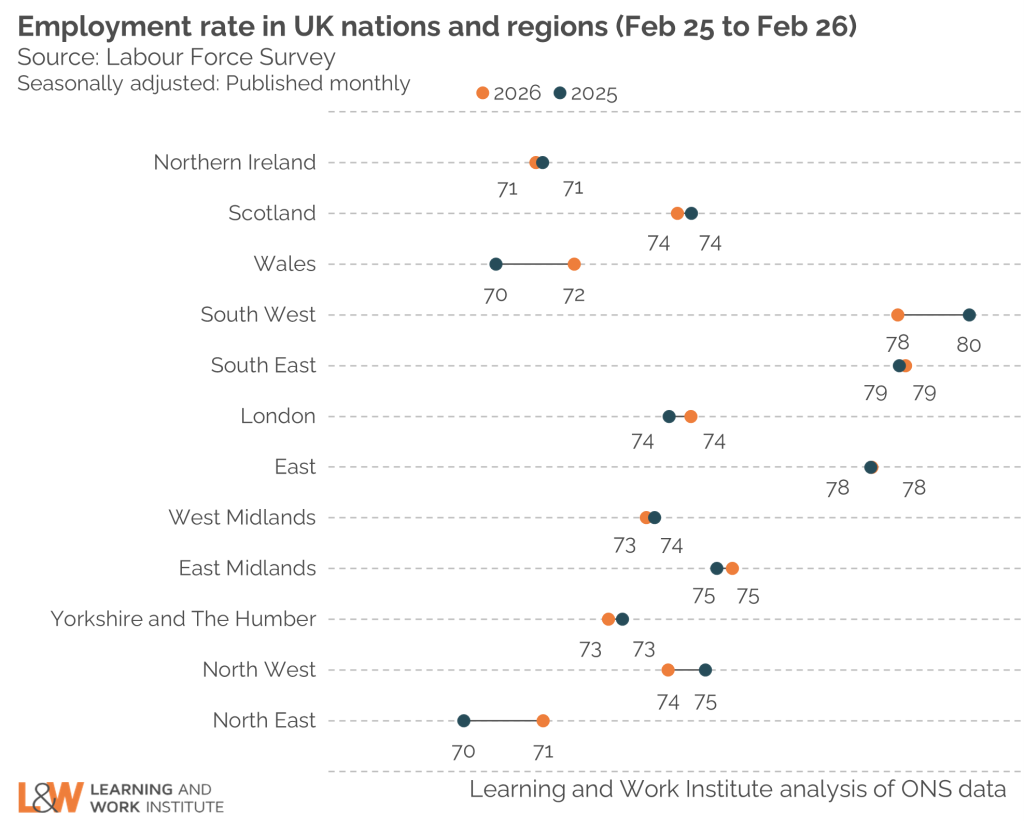
The smaller sample sizes underlying regional estimates of employment mean that caution is needed in interpreting changes over time. However, employment rates in the December 2025 to February 2026 quarter were higher than the equivalent quarter one year earlier in Wales and the North East of England. Both of these areas experienced a 1.2 percentage point increase in the employment rate. By contrast, employment rates in December 2025 to February 2026 were lower than they had been one year earlier in the South West and the North West of England. The fall in the employment rate over this period was greatest in the South West, where it declined by 1.4 percentage points. In Northern Ireland, Scotland, the South East, London, East of England, West Midlands, East Midlands and Yorkshire and the Humber there was little change in the employment rate compared with one year earlier.
The data challenge
Our headline indicators are based on data from the Labour Force Survey, but since the pandemic this has experienced a decline in the response rate which affects the reliability of estimates from this source. This is illustrated by the divergence in the employment rate estimated from the LFS and other sources over this period. While the ONS seeks to resolve these issues, we are publishing an experimental estimate of the employment rate based on an approach developed by the Resolution Foundation and using administrative data sources, such as HM Revenue and Customs payroll and self-assessment data on the numbers of people self-employed.
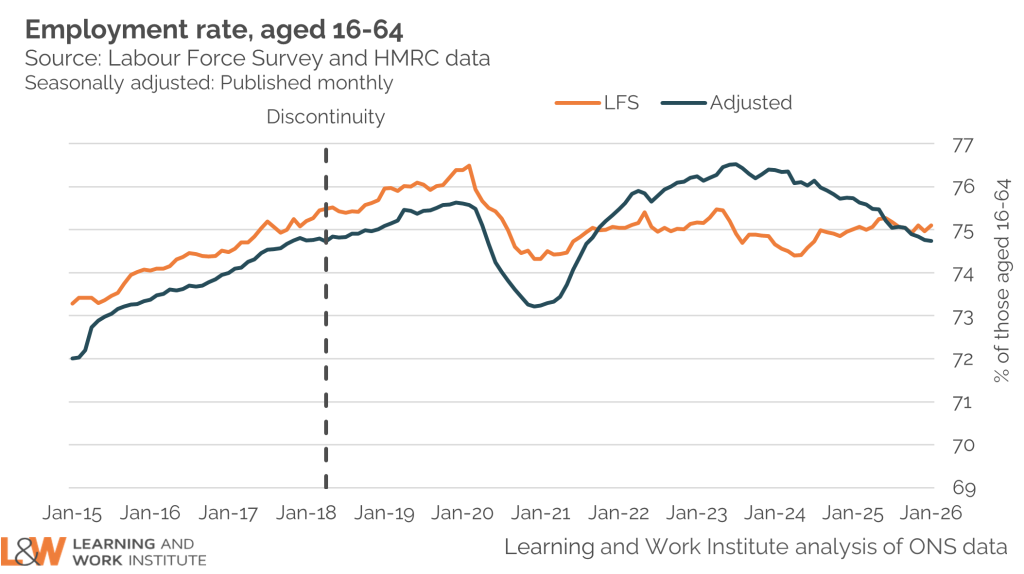
The divergence is substantially less stark than it was for reasons which are explained in the latest Labour Force Survey quality update from ONS. However, while the short-term trends may now be starting to align in the two data sources, the adjusted data series points to a much sharper decline in employment rates over the last year (from a higher starting point) – further evidence of a cooling labour market, and confirmation of the headache this Government faces.