

Every month, Learning and Work Institute produces detailed and timely analysis of the latest labour market statistics from ONS. We examine what the figures tell us both about the health of our labour market, and what they mean for people’s experiences of work, with a particular focus on groups facing labour market disadvantage. Become a supporter to receive our monthly briefing delivered directly to your inbox and navigate our labour market dashboard.
August 2026
Stephen Evans, Chief Executive at Learning and Work Institute, said:
The labour market is relatively flat overall. The bigger picture is that 3.9 million people are out of work and say they want a job, up by 600,000 compared to two years ago. Worryingly, employment in retail and hospitality is down most sharply, contributing to the 1.3 million young people not in work or full-time education, up one third since the pandemic. A growing economy is needed to restart the stalled engines of job growth, alongside offering people who are out of work more help to find jobs.
Beneath the headline statistics, our individual experiences of the labour market are affected by our backgrounds, life experiences, where we live and the type of work that we do. This month’s Labour Market briefing explores how these differences between individuals affect their employment prospects.
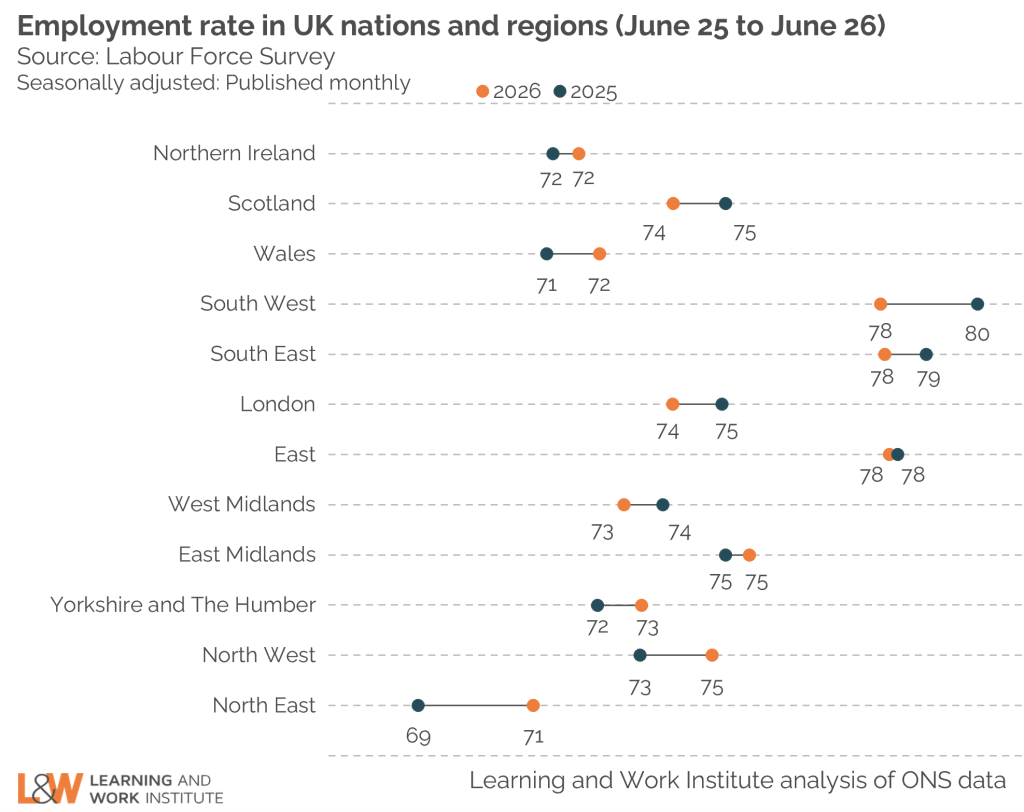
The government’s ambition of reaching an 80 per cent employment rate can only be achieved by improving employment opportunities in the parts of the country where people are currently least likely to be in work. Employment rates in the South West, South East and East of England are hovering at around 78 per cent – within touching distance of the target. But the North East in particular has further to go to close the gap, with the employment rate currently around 71 per cent. It remains to be seen whether greater devolution will be effective in raising employment rates, but there is no doubt that where someone lives has a bearing on their likelihood of being in work, so an in-depth knowledge of local labour markets will be a necessary pre-condition to close gaps between areas.
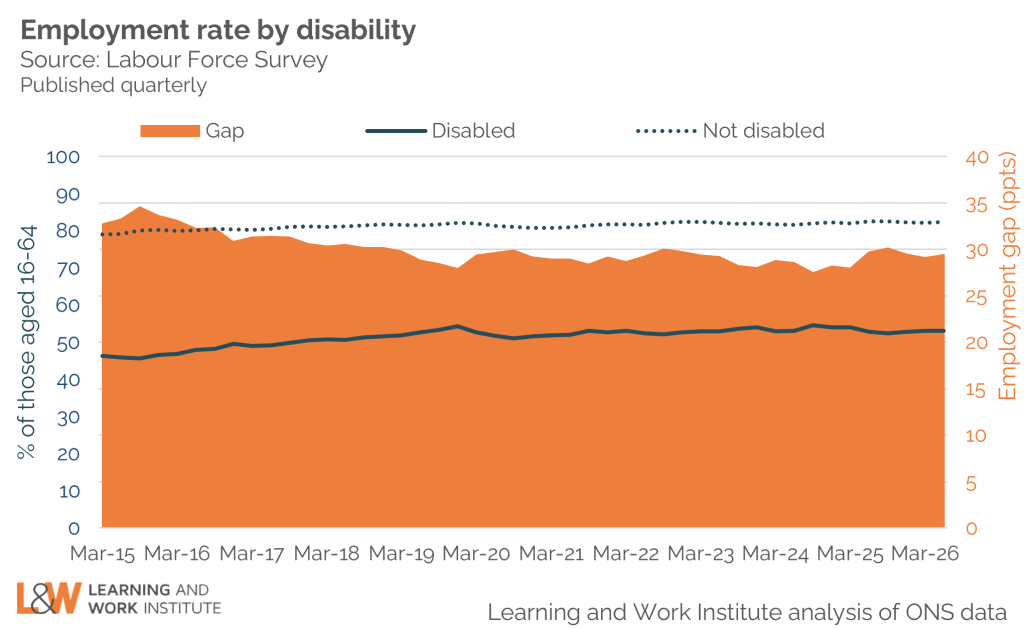
One of the biggest determinants of an individual’s likelihood of being in employment is their health. Just 53 per cent of people with a disability are employed, compared with 82 per cent of those without health problems. Furthermore, the size of this gap has not changed since before the pandemic. Of course, there’s a lot of activity to try to address this problem at the moment, including the Connect to Work and WorkWell programmes, the Keep Britain Working Review, the launch of the Pathways to Work innovation fund and today’s announcement that free bus travel for disabled people will be extended to cover journeys in England at any time of day from April 2027.
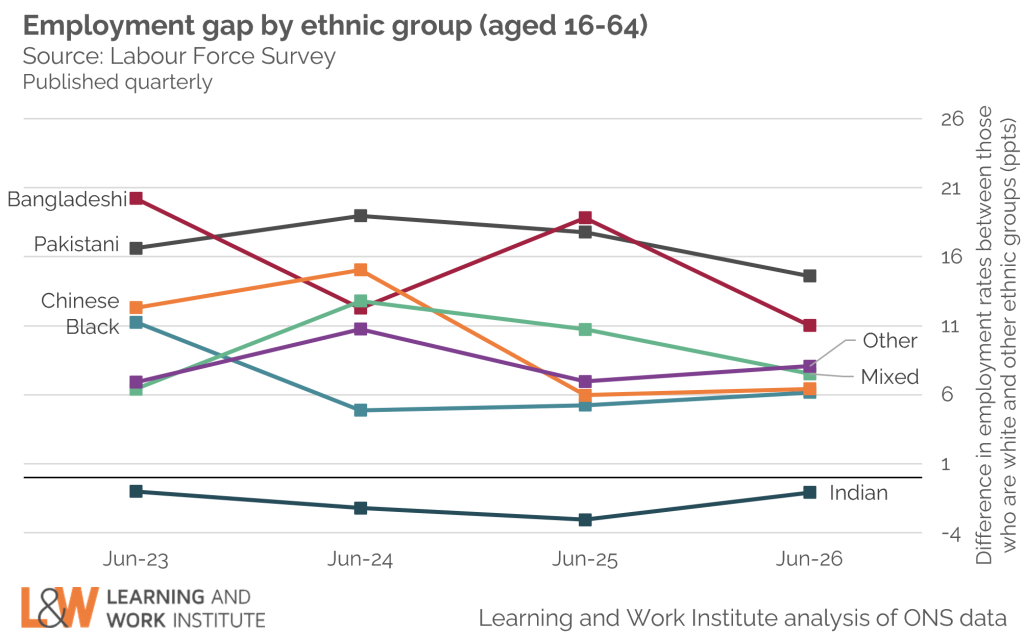
Ongoing problems with the Labour Force Survey hamper our ability to know exactly what is going on in the labour market below the headline statistics. Nowhere is this more evident than in relation to employment rates for people from different ethnic backgrounds. For some time now, the employment rate has been highest among people from an Indian background (77.5 per cent in April-June 2026), with those from a white background not far behind (76.4 per cent over the same period). Some ethnic groups have much lower employment rates (only 61.8 per cent of people from a Pakistani background were employed in the most recent quarter for example), but these can vary a lot over time, making it difficult to know what progress is being made in closing the gaps between groups.
As well as needing reliable information, increasing the employment rate is only possible if there are enough jobs to go around. That’s looking unlikely at present. The number of people who are either unemployed or economically inactive, but say they want to work, has been rising for some time now, whereas the number of vacancies has been falling.
With 5.5 people saying they want to work for every available job, the situation is particularly challenging for young people coming onto the jobs market after completing their studies this summer. Only 42 per cent of this year’s crop of 18-year-olds are heading off to university and the Retail and Hospitality sectors that have traditionally given young people their first taste of work are in contraction. So it’s crucial that there are pathways into further education and employment suitable for all young people, not just those of an academic bent. This depends not only on the government continuing to develop vocational pathways and financial support for apprenticeships (in line with recent announcements), but also on action by employers to provide the necessary work opportunities.
Labour supply (employment) still remains flat
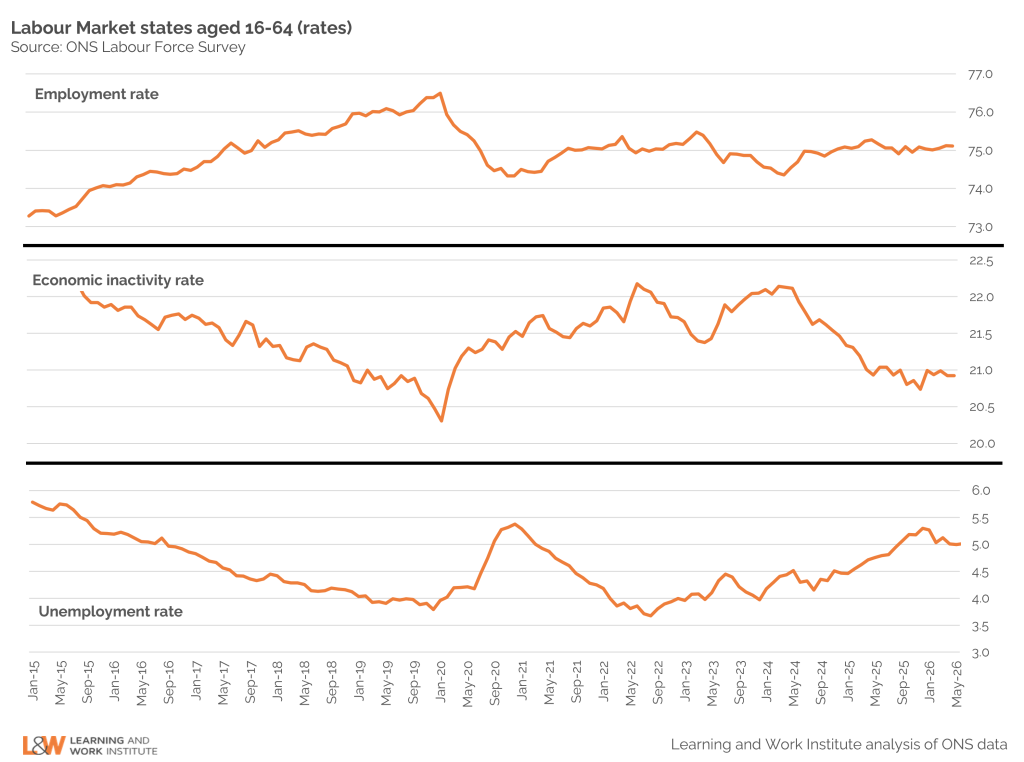
Once again, we see very little change in the headline labour market indicators from the Labour Force Survey. The employment rate was 75.1% in the April-June quarter of 2026, almost unchanged on the previous quarter, when it stood at 75.0%. In April-June 2025 the employment rate was 75.3%, so it has barely changed over the past year.
The rate of economic inactivity in April-June 2026 was unchanged on the previous quarter, at 20.9%. This is exactly the same as the economic inactivity rate in April-June 2025.
Completing the picture of stability, or stagnation, depending on your point of view, the unemployment rate was 5.0% in the April-June quarter of 2026, almost the same as in the previous quarter, when it stood at 5.1%. Compared with one year earlier, when the unemployment rate was 4.8%, the current rate of unemployment is slightly higher.
Headline figures mask substantial declines in employment in key sectors
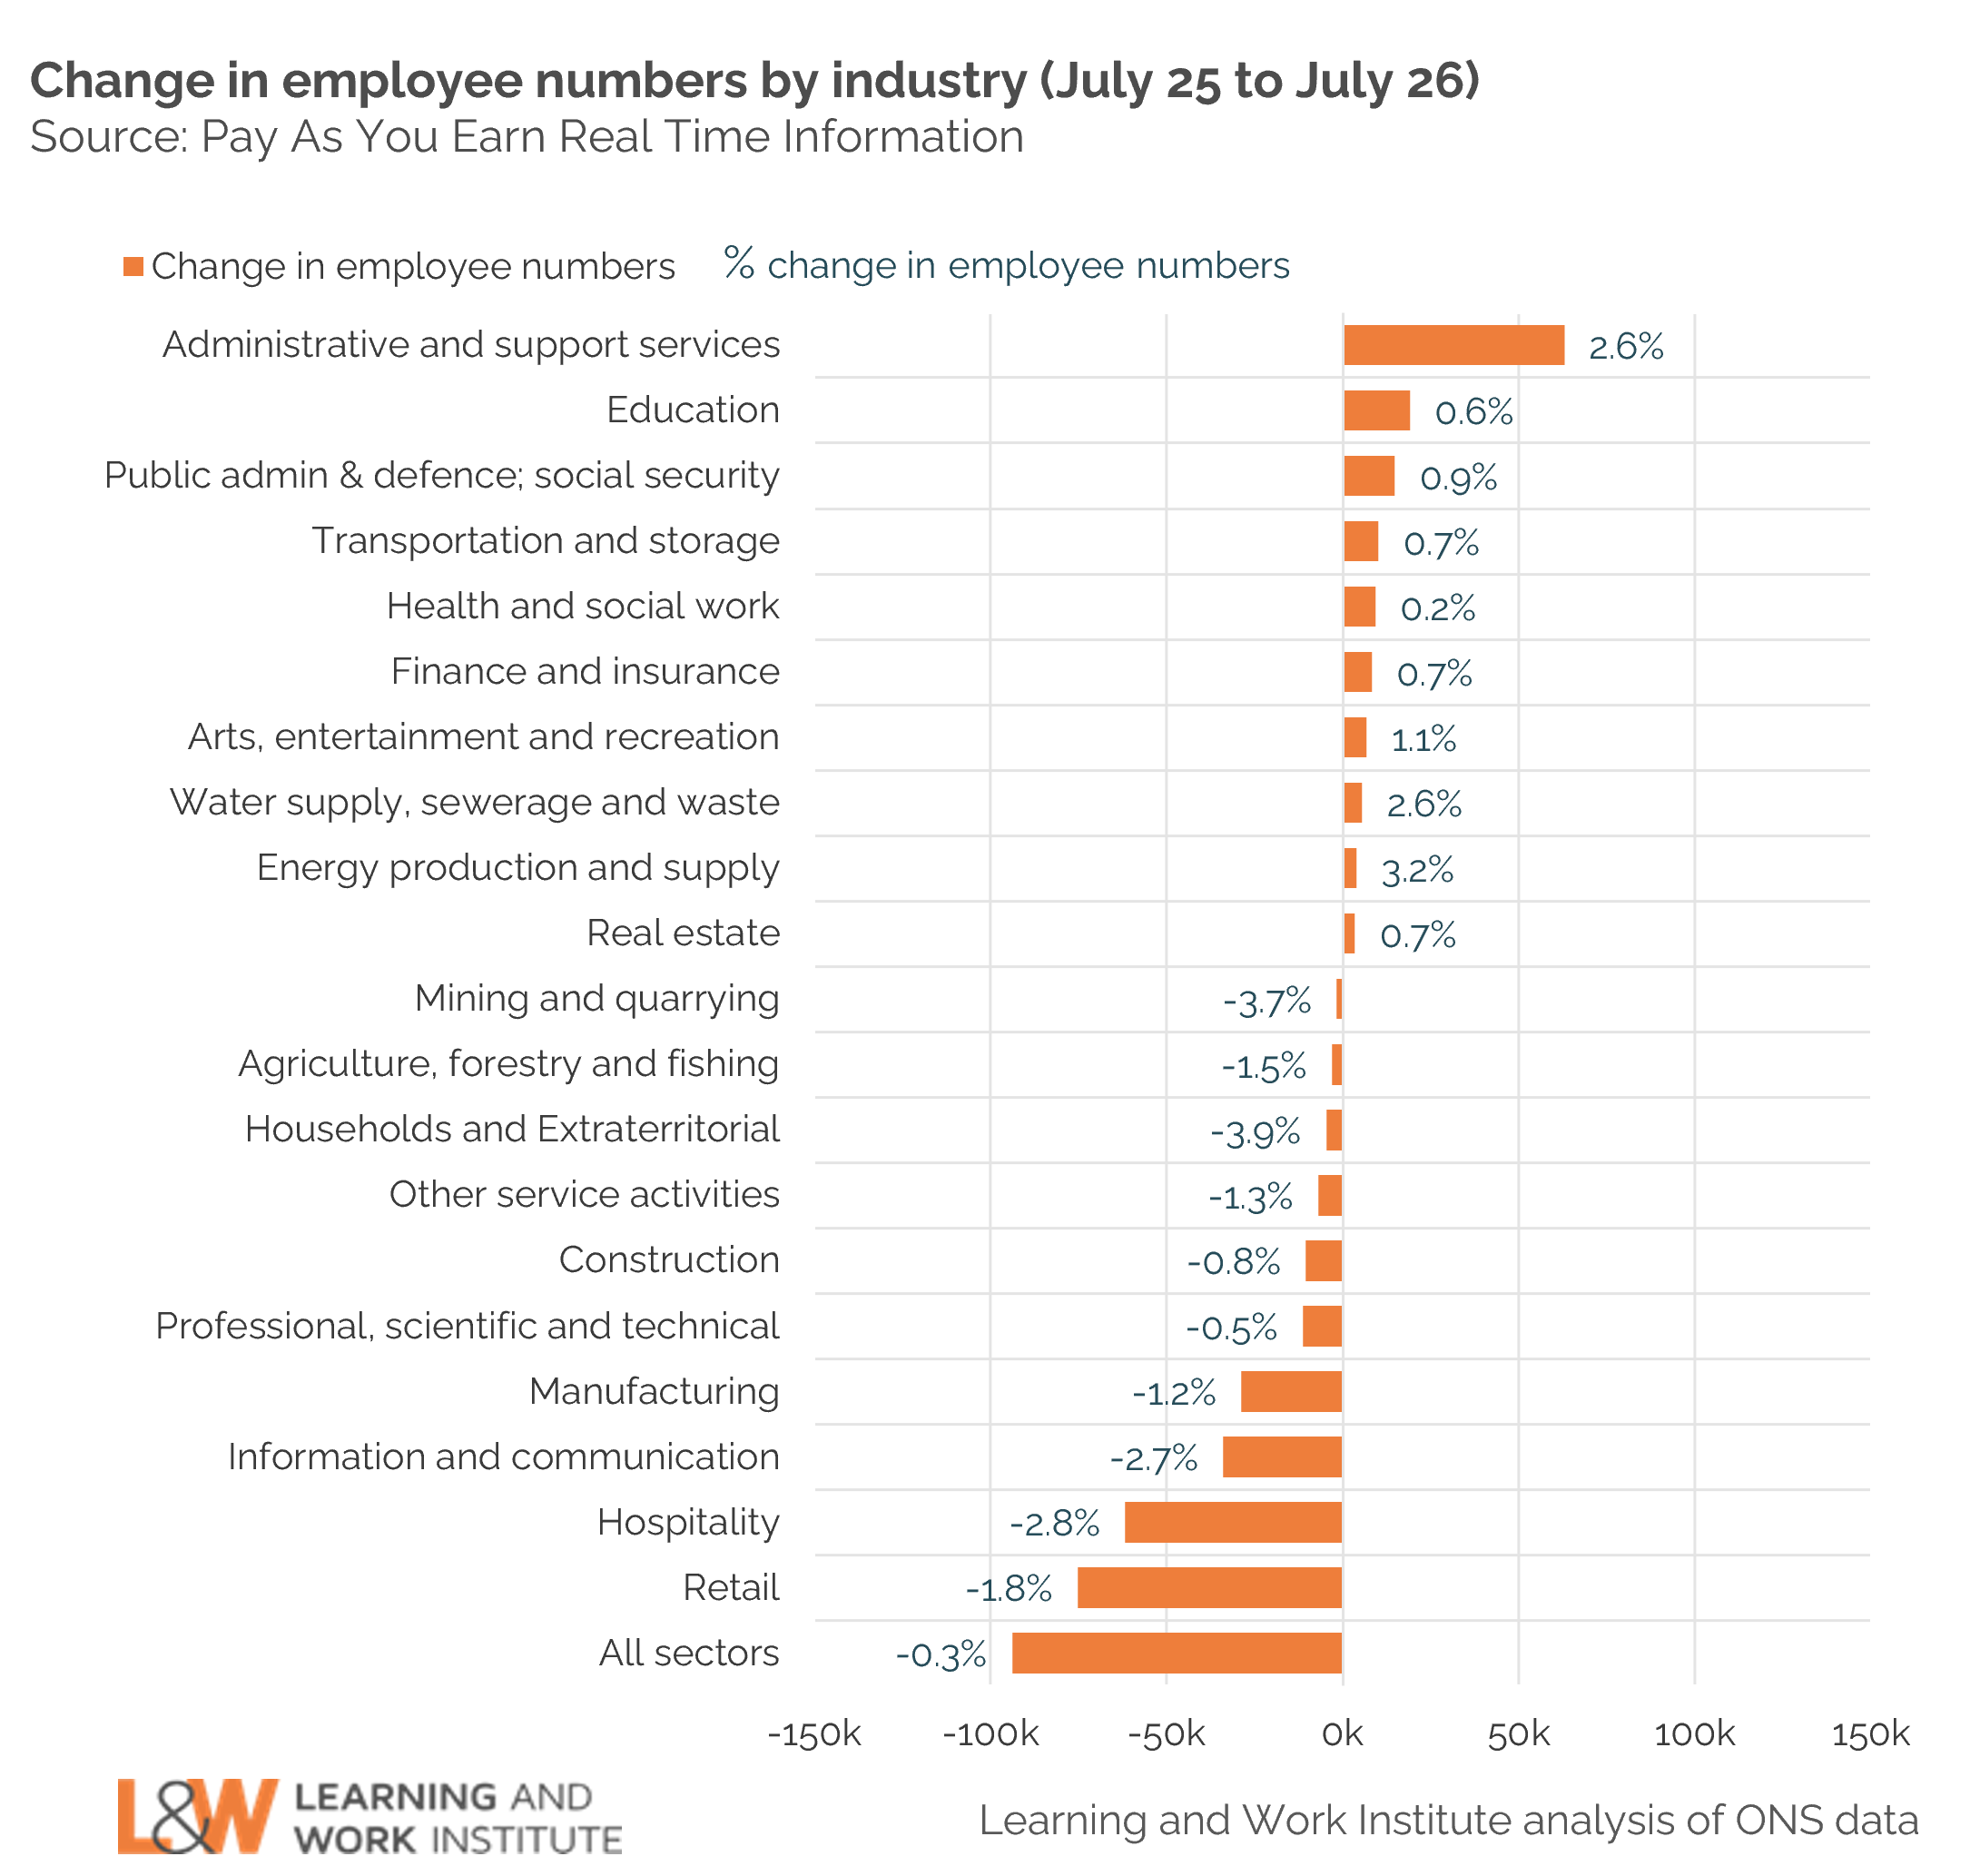
Although there has been little change in the labour market at the economy-wide level over the past year, changes are apparent within particular sectors. Overall, PAYE data shows that by July 2026 employee numbers had fallen by 29,000 compared with three months earlier and 94,000 compared with a year earlier. Given that there are around 30 million employees in the UK, this means that, like the Labour Force Survey, the PAYE data shows that the labour market is basically unchanged on a year ago.
However, at sector level, Retail and Hospitality have experienced the largest falls in the numbers of employees over the past year (reductions of 75,000 and 62,000 respectively). Other sectors have experienced larger declines in the number of employees in percentage terms, but as more than one-in-five employees currently work in Retail and Hospitality, cuts to these sectors have far-reaching consequences. On a more cheerful note, the numbers employed in Administrative and support services have grown by 63,000 (2.6 per cent of the workforce) in the past year. But this is not enough to offset reductions in the size of the workforce elsewhere.
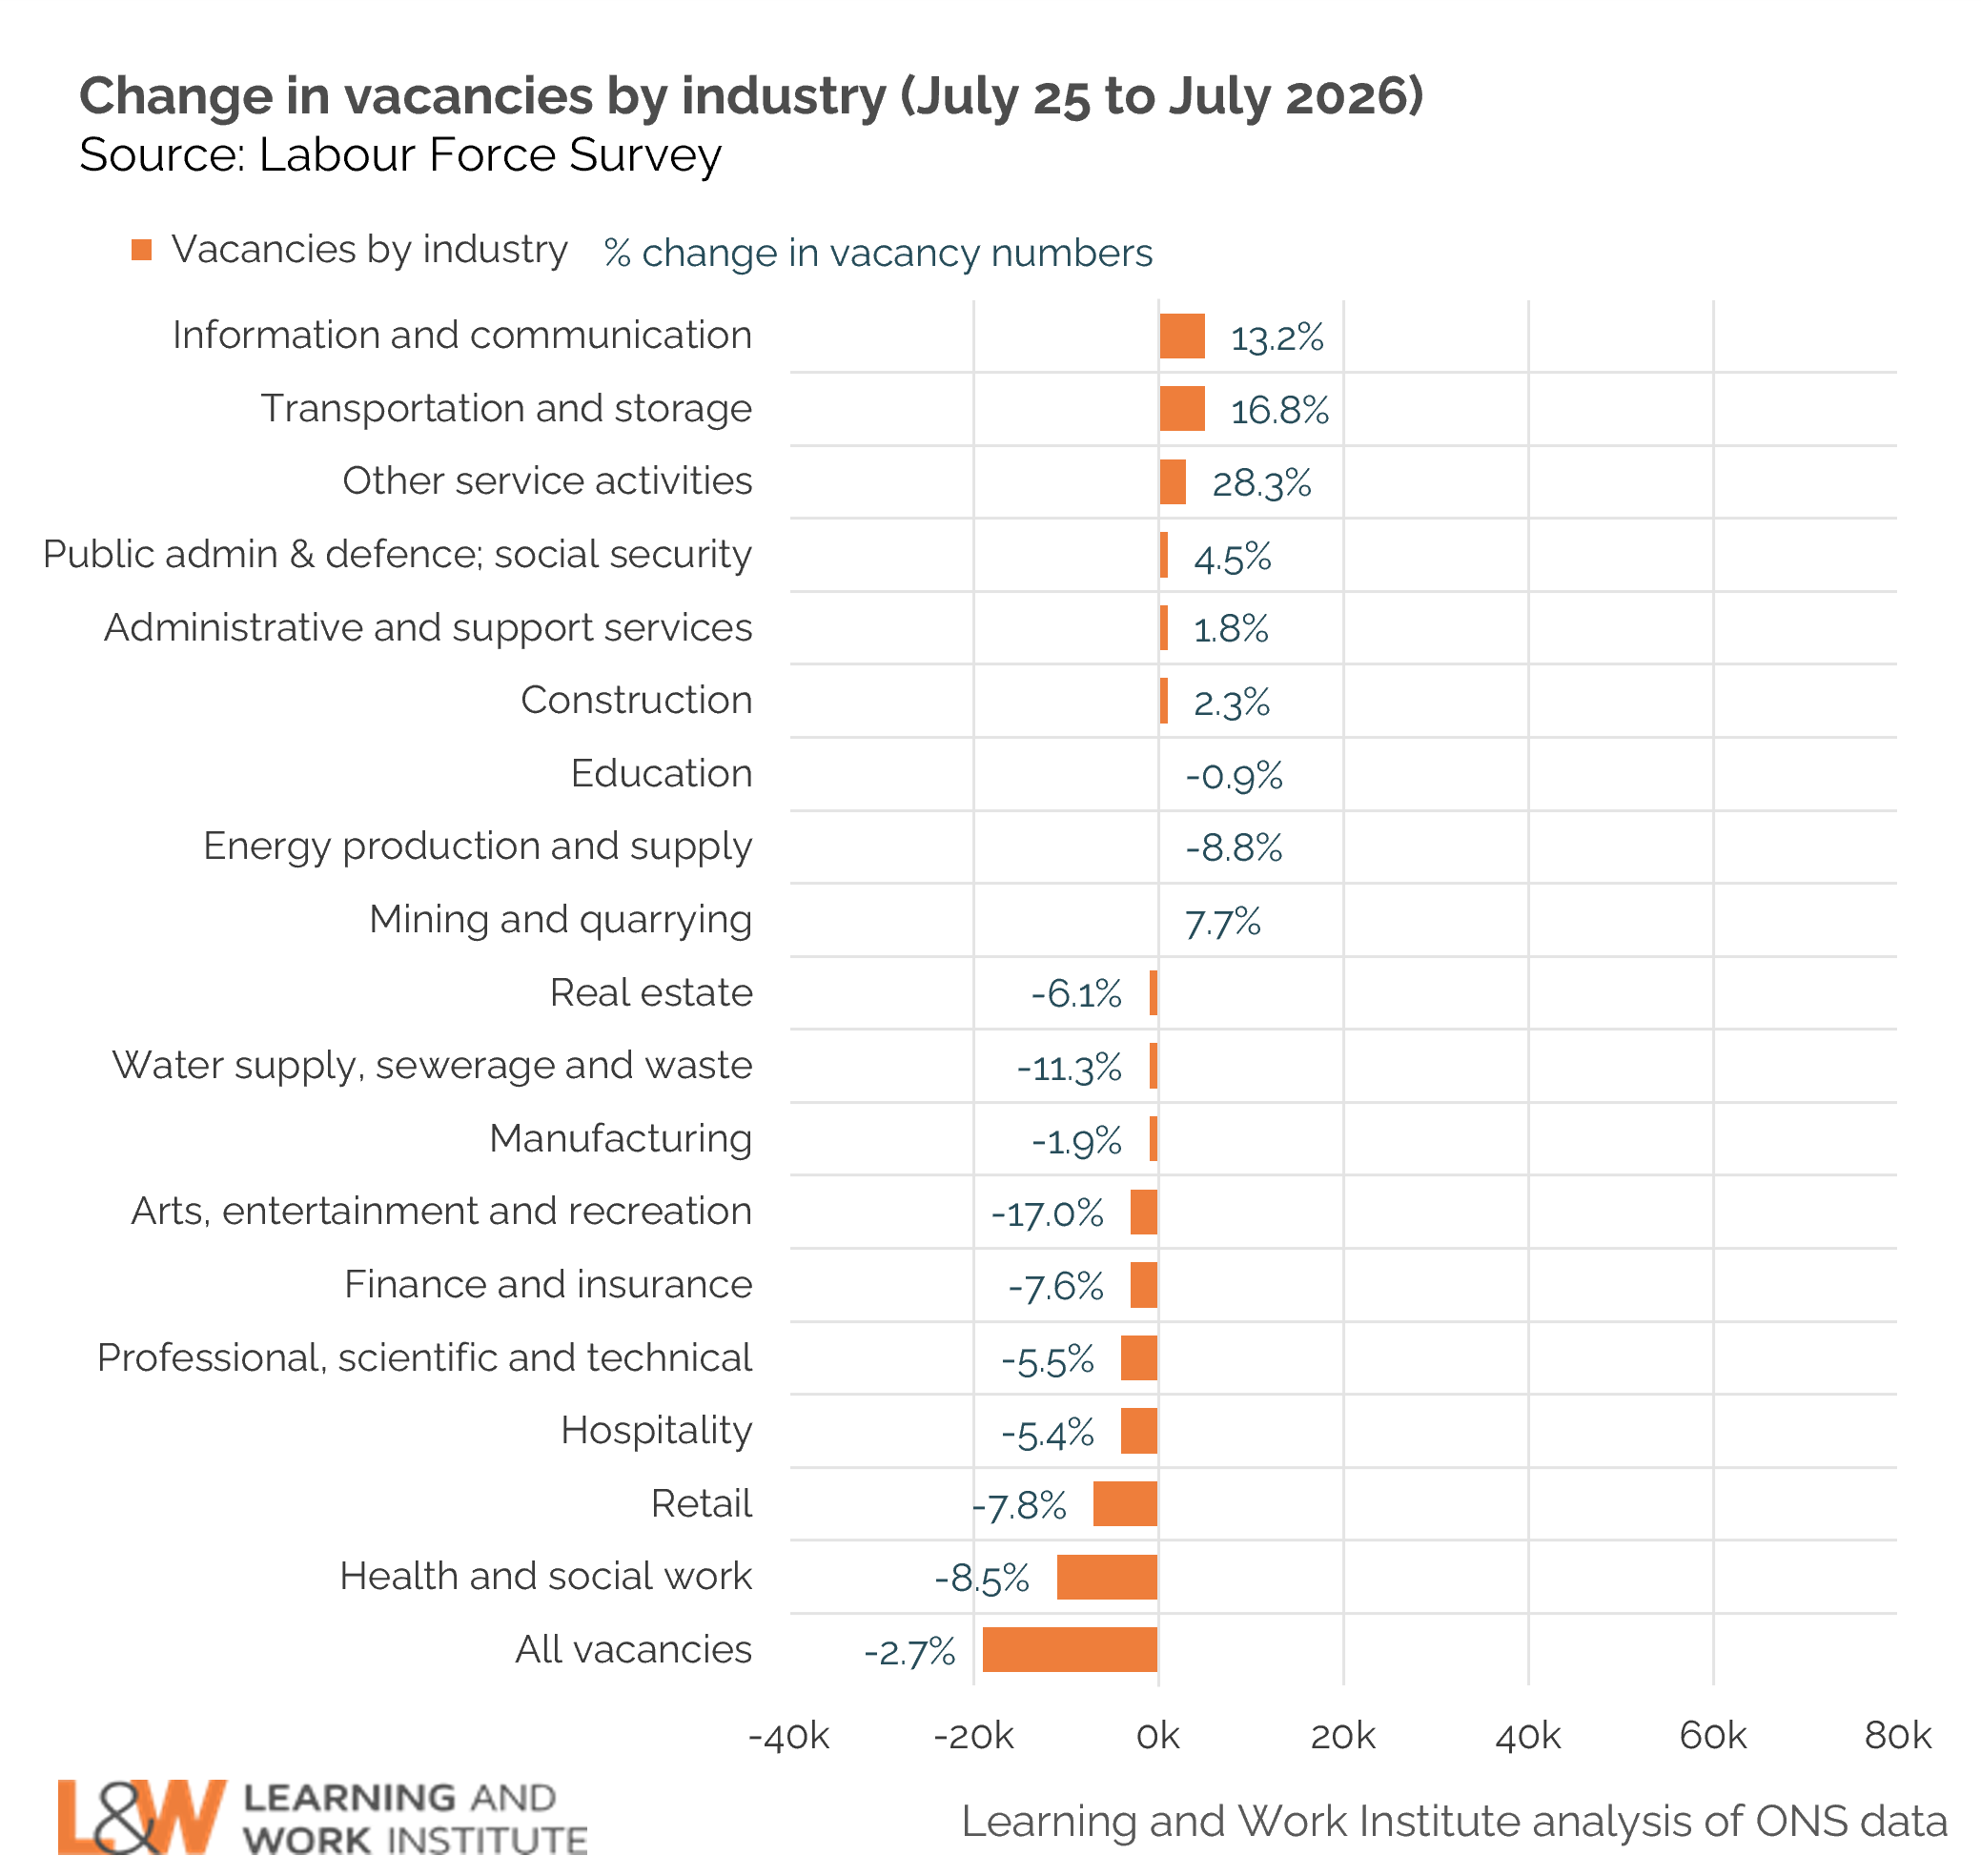
Worryingly, vacancies have also fallen by around 19,000 over the past year (a decline of 2.7 per cent), continuing a long-term downward trend which started in the April-June quarter of 2022. Again, the Retail and Hospitality sectors have seen the greatest reductions, with vacancies in Retail falling by 7.8 per cent over the past year and a 5.4 per cent reduction in the number of vacancies in Hospitality over the same period. But the biggest reduction in vacancies has been in the Health and social work sector, which has experienced a decline of 11,000, or 8.5 per cent. As this sector employs the greatest number of employees, signs that the number of vacancies are falling signal more difficult times ahead.
Of course, the summer is the time of year when a new cohort of young people take their first steps out from education and into the labour market. Compared with the same quarter one year earlier, the number of 16-24-year-olds not in full-time education or employment rose by around 90,000 to 1.3 million in the April-June quarter of 2026, an increase of 7.4 per cent. The sectors that have experienced the greatest contractions in employment in recent times, namely Retail and Hospitality, have traditionally provided young people with their first experiences of work.
Of the 707,000 young people turning 18 in the 2025/26 academic year, only around 42 per cent applied for university. So it’s essential for the health of the labour market to have pathways into further education and employment for all young people. The Prime Minister’s recent announcement that the government intends to improve vocational pathways from the age of 14 and reduce the financial barriers to apprenticeships faced by the most disadvantaged young people seeks to address this problem. However, the success of the response depends on employers providing the work experience opportunities necessary for young people to make the transition into work. And employers and young people, need to have confidence in the quality of vocational qualifications for them to gain the same standing as A-levels. Finally, long-term underinvestment in adult education by the government and employers needs to be addressed to ensure that young people who fall through the cracks in the current education system have routes back into learning later in life. This is something that we are seeking to address through our campaign to Get the Nation Learning.

Employment prospects vary between areas
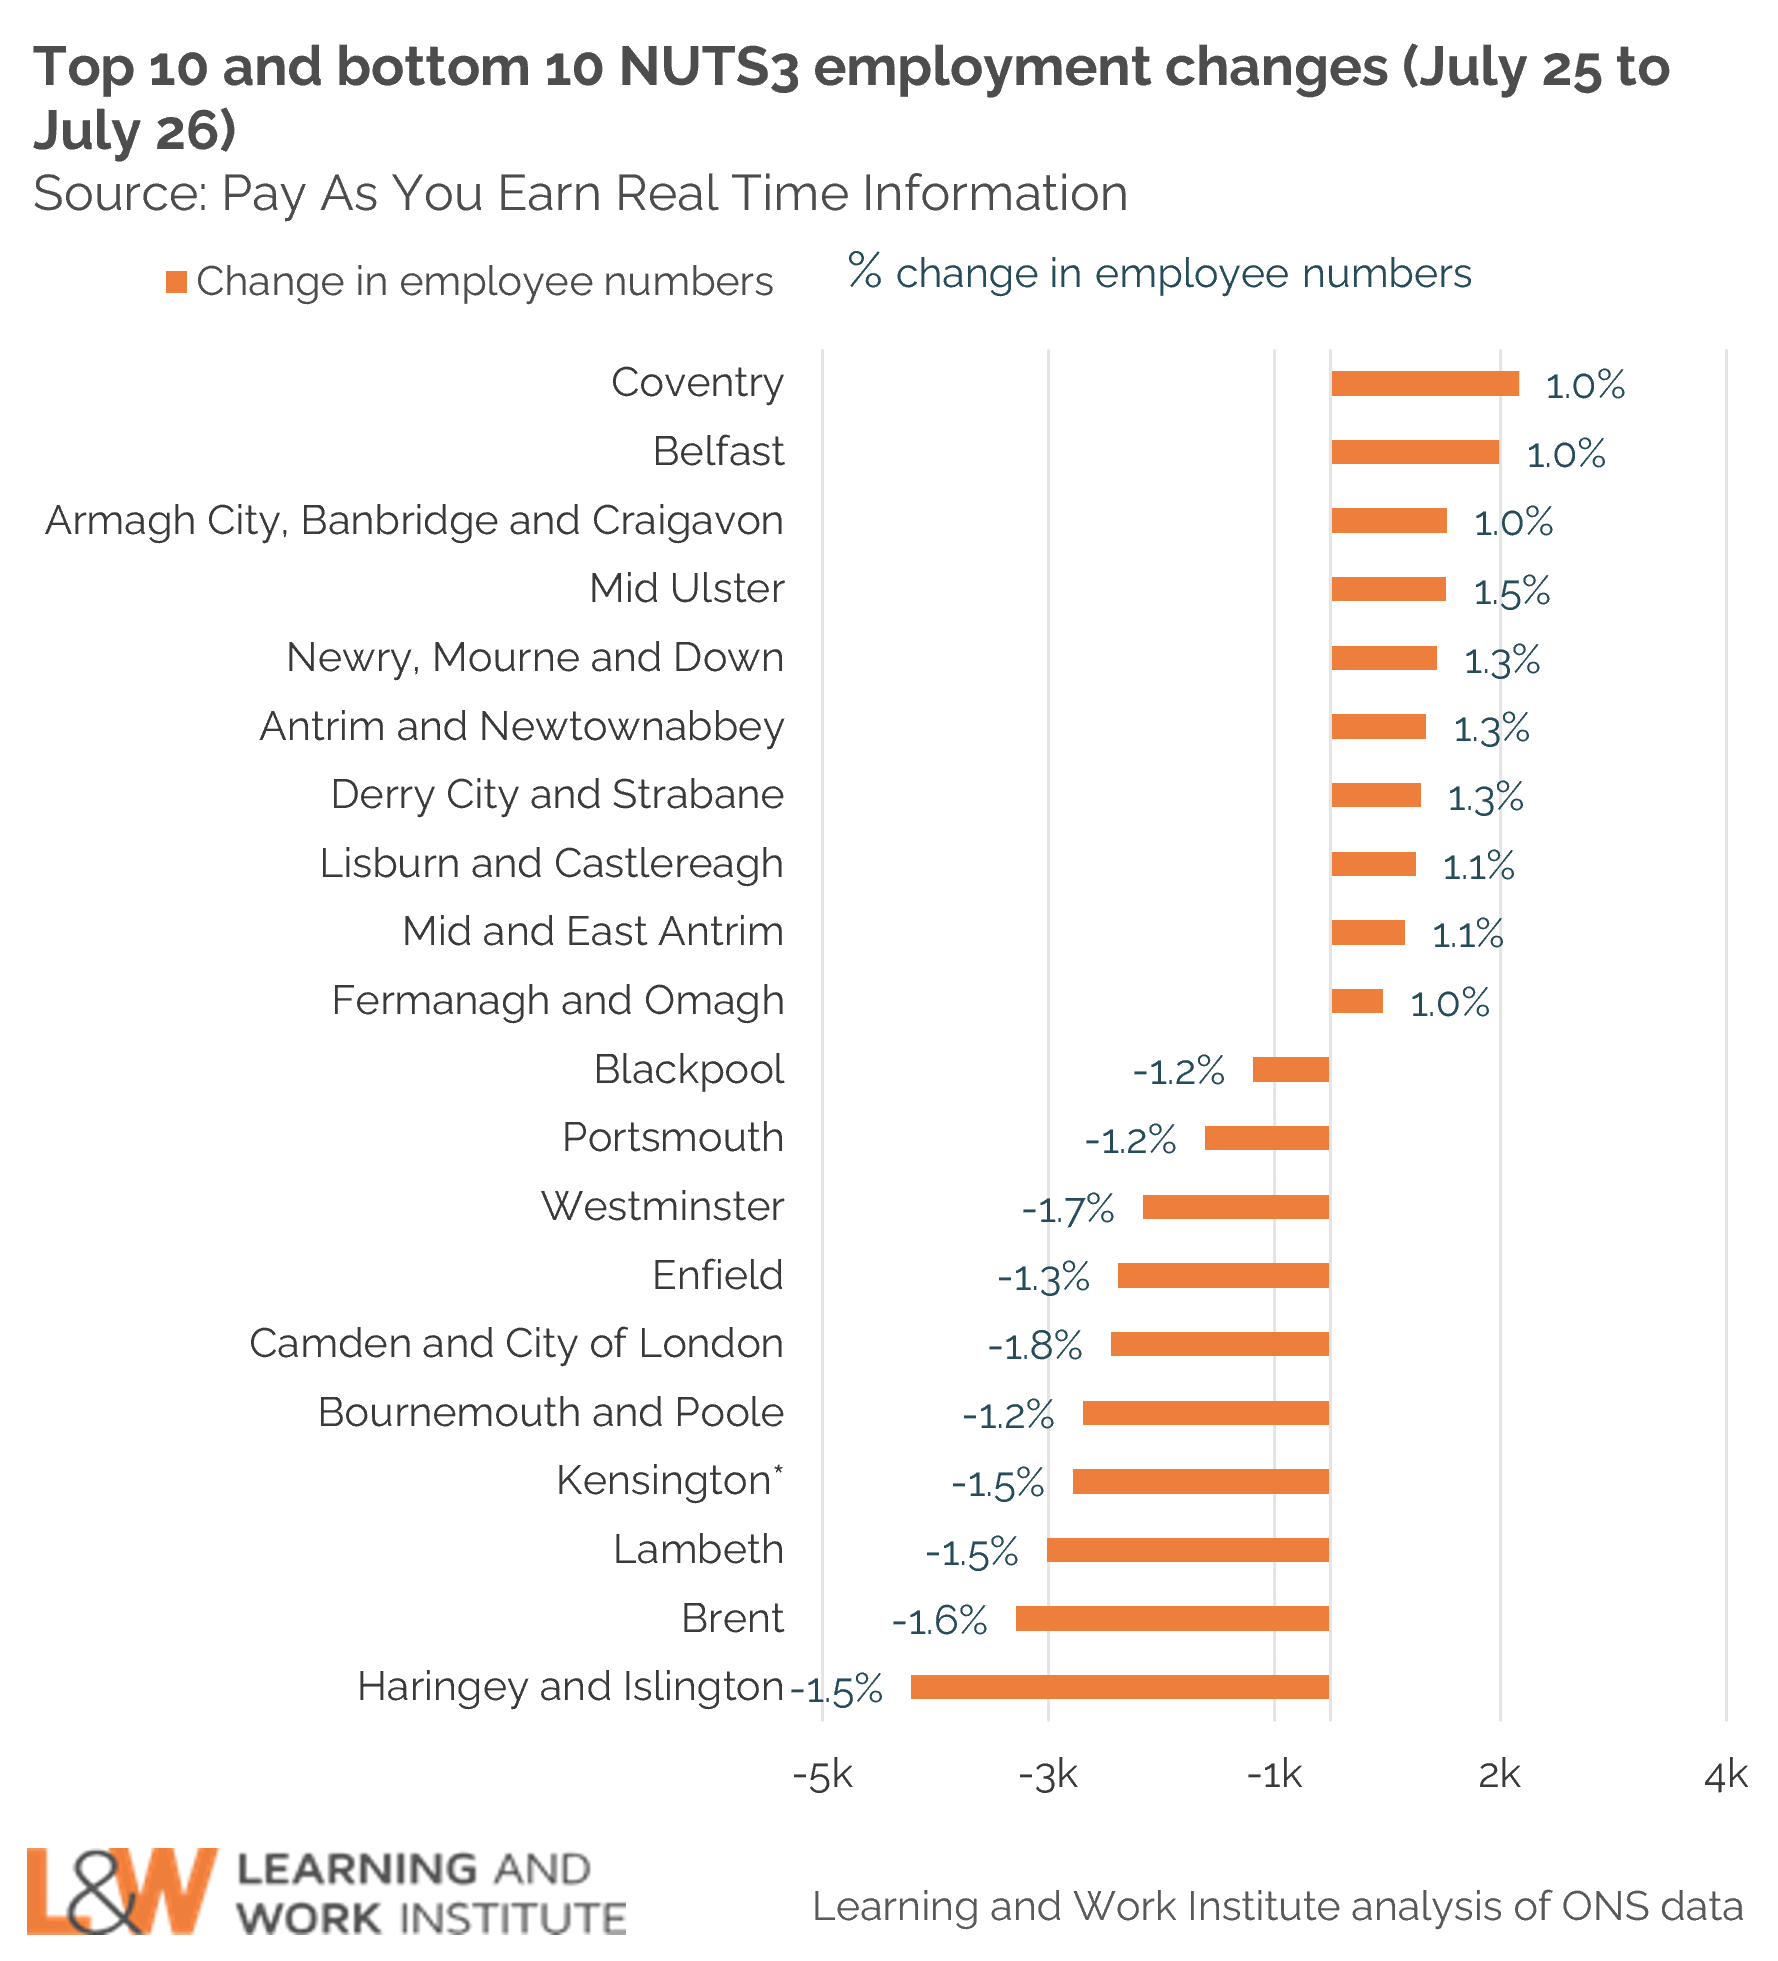
As we’ve mentioned in previous briefings, some parts of the country are much closer to achieving the government’s ambition of an 80 per cent employment rate than others. This month we use PAYE data to show how the number of employees in different parts of the country has changed over the past year.
Coventry experienced the largest increase in the number of employees, rising by 1,663 between July 2025 and July 2026, but the greatest change in percentage terms was in Mid-Ulster (1.5 per cent). Here the number of employees rose by 1,024 over the past year. Aside from Coventry, all the areas which saw the largest percentage increase in the number of employees between July 2025 and July 2026 were in Northern Ireland, although employment rates have tended to be lower there than in many other part of the UK.
At the other end of the spectrum, Haringey and Islington experienced the largest fall in the number of employees over the past year, a decline of 3,712 employees, while as a percentage of local employment, Camden and City of London saw the greatest reduction (1.8 per cent, or 1,943 employees). London boroughs dominate the list of areas which have experienced the largest contractions in the number of employees in percentage terms over the past year, but Blackpool, Portsmouth and Bournemouth and Poole are also among the worst affected areas.
As the Labour Force Survey is based on much smaller sample sizes than the PAYE data, it is only possible to look at changes in the employment rate at a regional level. However, it does show just how much the employment rate varies between regions. The South West, South East and East of England are much closer to achieving an 80 per cent employment rate than Northern Ireland, Wales or the North East. The scale of these regional disparities highlights the need to boost the employment rate in the areas where it is currently lowest to catch-up with the highest performing parts of the country. The recent Cabinet statement on Rewiring the State makes it clear that greater devolution of employment support and skills policy will be a key part of the government’s proposed approach to closing the gap in the employment rate between regions.
Ill-health remains a major barrier to work
The latest data shows that the huge gap in employment rates between people with, and without, a disability has barely changed since before the pandemic. In the April-June quarter of 2026 53.0 per cent of people with a disability were employed, compared with 82.4 per cent of those without a disability – a difference of 29.4 per cent. Although the employment rate for people with a disability was lower in the same quarter in 2019, when it stood at 52.6 per cent, the differences in the employment rate compared with those without a disability was also smaller (28.8 per cent).
The persistently low employment rate for people with health problems was highlighted in the Keep Britain Working Review, which explored the role of employers in tackling health based economic inactivity and promoting healthy and inclusive workplaces. Today’s figures show that, in addition to the 534,00 people with a disability who are unemployed, there are 754,000 people who are economically inactive due to long-term sickness who want a job. Supporting both of these groups into work could raise the employment rate for disabled people to closer to 65 per cent.
So the question is what changes are needed to close this gap? The launch of the £60 million Pathways to Work innovation fund, which is due to open for bids in September, is an attempt to answer this question. Under the scheme, organisations with expertise in working with disabled people can apply for funding to develop and test initiative to help them get into, and remain in, work. At L&W we’ve recently been reviewing the evidence on local work and health programmes. This has revealed that the current evidence on what works is limited – something for the planned What Works Centre for local employment support to address – but has uncovered some top tips for local service design, based on promising practice. Today’s announcement that disabled people in England will be entitled to free bus travel at any time of day from April 2027 will also help those who meet the eligibility criteria – something that is already available in Scotland and Wales, but not in Northern Ireland.
The difficulties faced by those wanting to work while experiencing ill-health are compounded for individuals who are subject to other forms of disadvantage in the labour market. The Race Equality Foundation has recently launched a campaign highlighting how racial inequalities can put employees with long-term health problems at a disadvantage in terms of access to healthcare, as well as support in the workplace. Today’s figures clearly illustrate that there are differences in the employment rate between people from different ethnic backgrounds. Only people from Indian backgrounds are more likely to be employed than those from white backgrounds, with employment rates of 77.5 per cent and 76.4 per cent respectively in the April-June quarter of 2026. People from a Pakistani or Bangladeshi background had the lowest employment rates over this period, at 61.8 per cent and 65.4 per cent respectively.
However, it is difficult to know how much progress is being made to close gaps in the employment rate between ethnic groups over time due to the lack of reliable data to measure changes, something highlighted in the Race Equality Foundation’s recent report, ‘Too Poor to be Sick’. The latest release of ONS data on employment rates by ethnicity shows how these jump around for different groups over time, even when focusing on a comparable month in each year to remove seasonal differences. So although we know that the employment rate is lower for most ethnic groups compared with those from a white background, it is much harder to say whether these gaps are narrowing.
Real pay growth remains low, meaning cost of living challenges remain
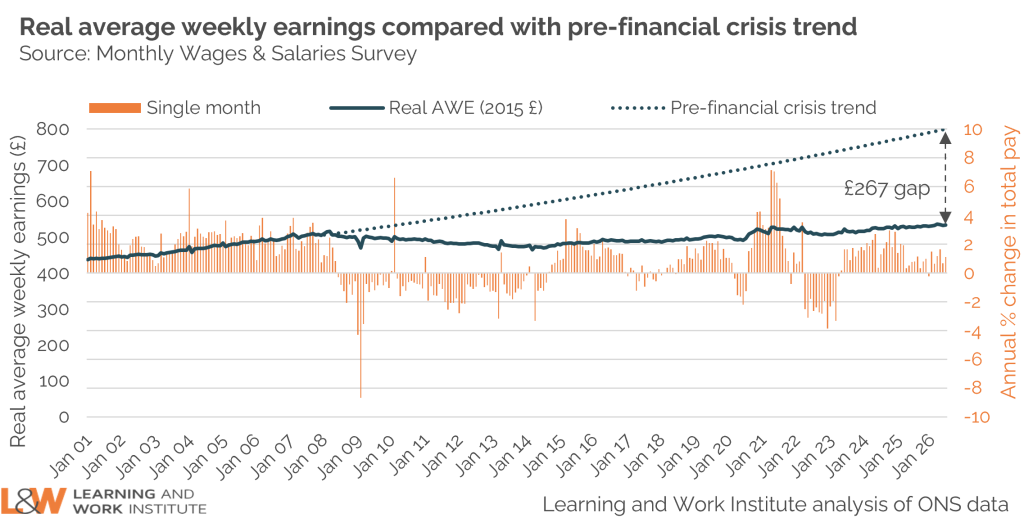
Although average regular weekly earnings in June 2026 were 3.5 per cent higher than a year ago, pay growth is only 0.5 per cent after taking into account inflation over this period. Compared with the trend in wage growth prior to the financial crisis, the average employee is over £12,000 a year worse off.
Despite the recent fall in inflation, the Monetary Policy Committee expects high energy prices caused by the war in the Middle East to continue to exert upward pressure on wages in the coming months. However, the expectation is that over the longer-term this will be offset by the increasing number of people looking for work relative to the number of vacancies. In the April-June quarter of 2026 there were 2.5 unemployed people for every vacancy. And when the numbers of economically inactive people who want to work are also included, there are 5.5 people who say they want to work for every available job, up from 3.8 people for every vacancy in April-June 2024. Longer-term solutions to the cost-of-living challenges facing many depend on stimulating economic growth and increasing the supply of well-paid jobs available to all.