



Every month, Learning and Work Institute produces detailed and timely analysis of the latest labour market statistics from ONS. We examine what the figures tell us both about the health of our labour market, and what they mean for people’s experiences of work, with a particular focus on groups facing labour market disadvantage. Become a supporter to receive our monthly briefing delivered directly to your inbox and navigate our labour market dashboard.
September 2026
Stephen Evans, Chief Executive at Learning and Work Institute, said:
Headline stability in the job stats masks two underlying and related challenges. The first is that one million young people are not in education, employment or training, risking long-term harm to their career prospects. Ramping up efforts to change that can’t wait. The second is the stalling of job growth in parts of the private sectors like retail and hospitality, down 150,000 payroll jobs since last year. This limits first job opportunities for young people and reflects underlying economic weakness that ongoing international uncertainty won’t help. The employment rate is relatively high by international standards, but risks trending in the wrong direction with 3.9 million people not in work but saying they want a job.
Beneath the headline stats, the picture that emerges this month is one of a labour market that has stopped getting worse but hasn’t shown much sign of getting better. For the most part, the competition facing those looking for work has been steadily intensifying with more people wanting a job but fewer jobs available for them to apply for. While the upward trend in the number of jobseekers to vacancies shows signs of having peaked, the difficulty is where it has levelled off. There are still almost five and a half people who say they want to work for every available vacancy, and the number of vacancies has largely been on a downward path since the end of the pandemic, falling by 36,000 over the past year. For jobseekers, this is not the sort of stability they’re hankering after.
Retail and hospitality continue to account for a large proportion of the fall in employee numbers over the last twelve months. These sectors employ over one in five people and have traditionally given young people their first experience of work. With hospitality experiencing one of the largest reductions in the number of vacancies over the past year of any sector, the prospects for one million young people not in education, employment or training continue to be challenging. Demand for those in skilled roles also looks weak, with the Professional, scientific, and technical activities sector experiencing one of the biggest declines in vacancies over the past year. All this is against a backdrop of rising redundancies, following an increase in potential redundancies notified to the Insolvency Service in May. However, notified redundancies have fallen in recent months, suggesting that better times may be ahead.
This month, we also take a look at some longer-term stories: Connect to Work, the flagship programme for people furthest from the labour market, which remains behind even its revised delivery estimates; and the hollowing out of employer investment in training, the subject of our research published last week, funded by the Nuffield Foundation. While these may not move the needle on the monthly statistics, they provide a look forward, exploring how future jobs growth might be achieved.
The labour market remains stagnant – or stable, depending on your point of view
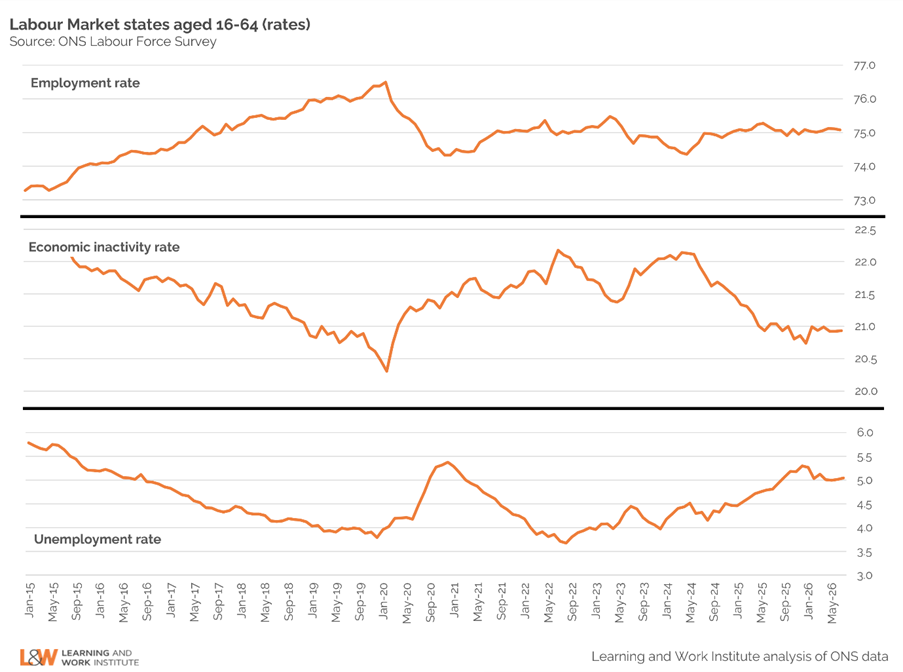
Once again, the headline employment figures from the Labour Force Survey show little movement. The employment rate was 75.1% in the May-July quarter of 2026, unchanged on the previous quarter and almost exactly the same as in the same quarter in 2025, when it stood at 75.2%.
The rate of economic inactivity in the May-July quarter of 2026 was 20.9%, very slightly lower than in the previous quarter, when it was 21.0%. The rate of economic inactivity was also 21.0% in the May-July quarter of 2025.
The unemployment rate is unchanged on the previous quarter but has risen a little over the past year, from 4.8% in May-July 2025 to 5.0% in the most recent quarter.
As we said last month – this is a story of stagnation or stability, depending on your perspective. From the point of view of individual jobseekers, this ‘flat’ picture is likely to feel like quite a challenging environment.
There are 5.5 people wanting a job for every vacancy – up from 5.1 this time last year
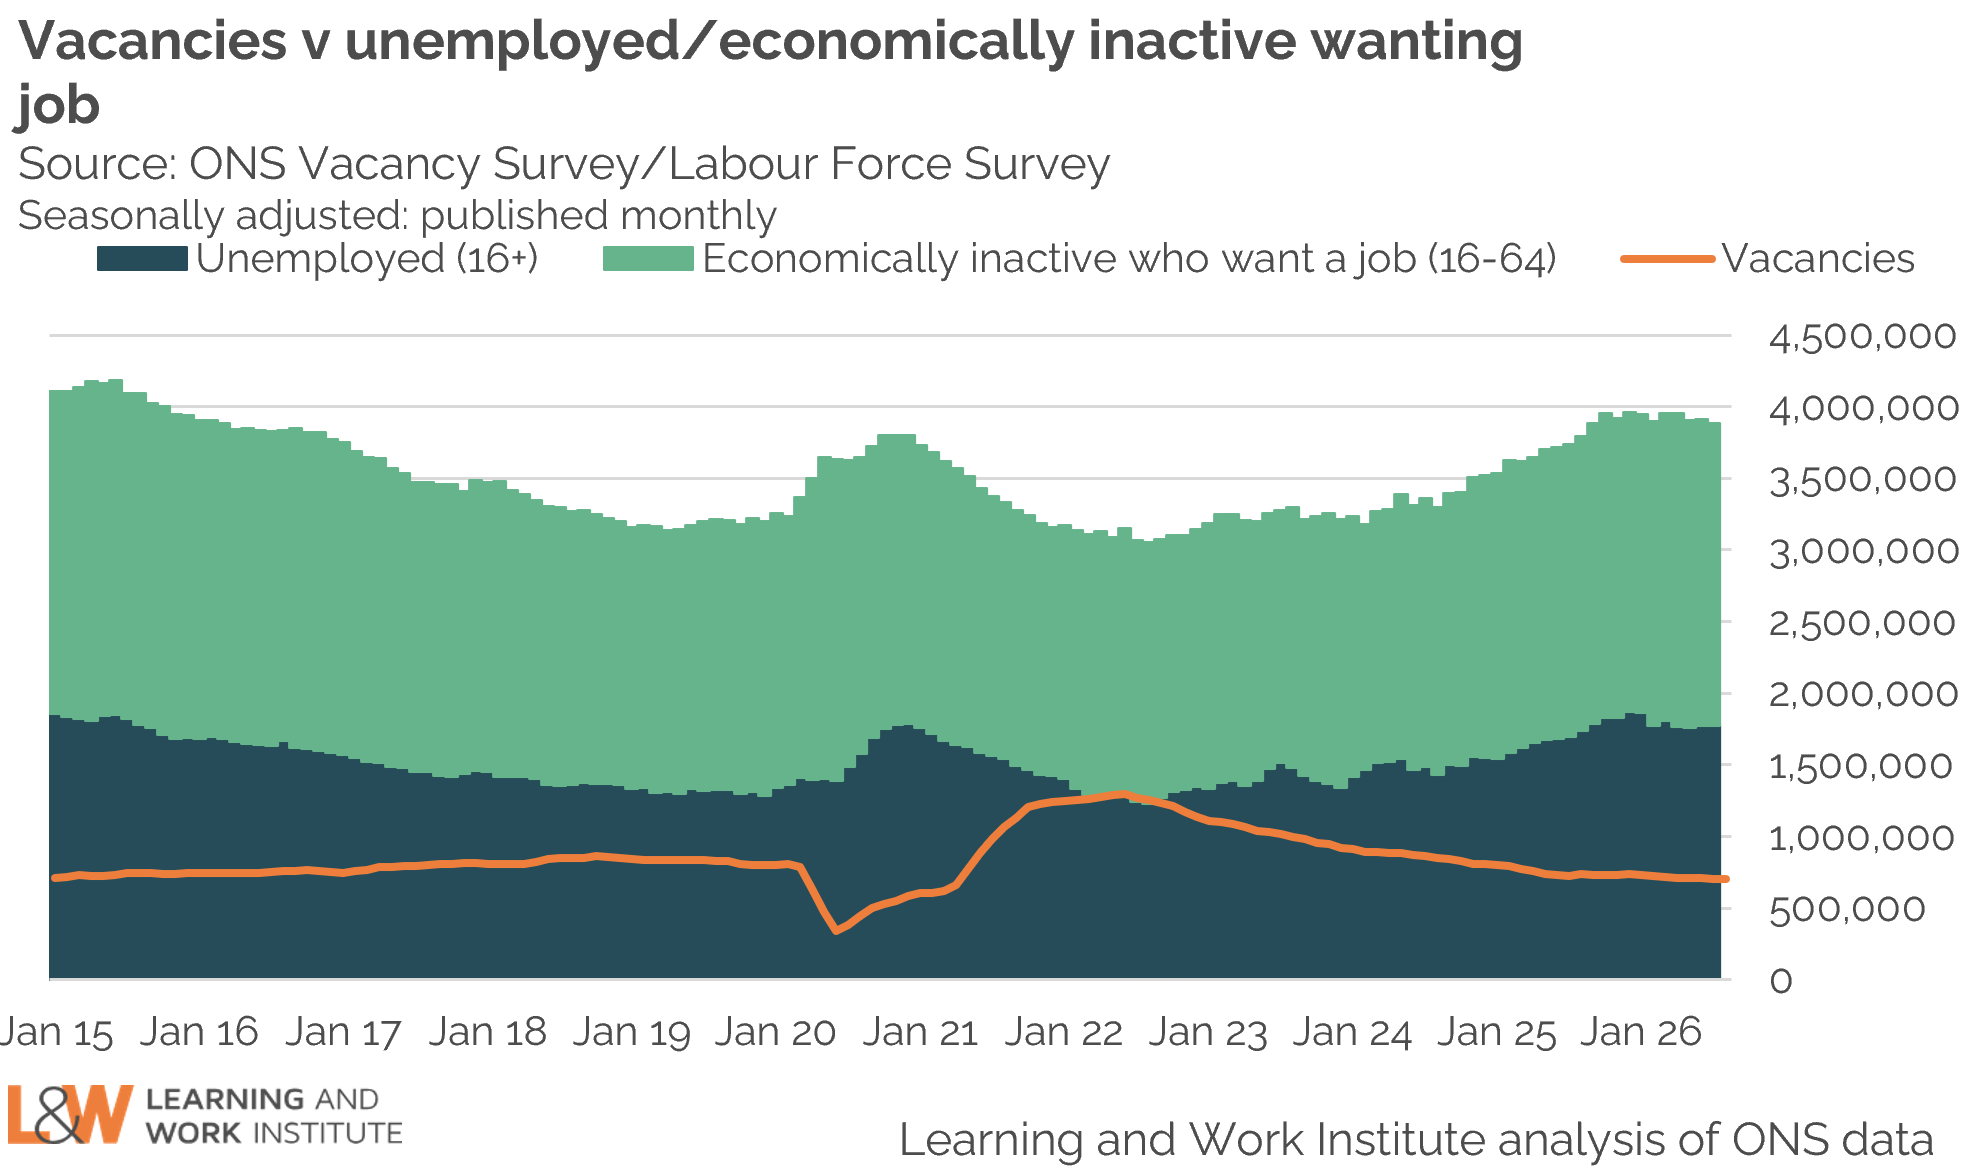
There are 5.5 people out of work and wanting a job (either unemployed, or economically inactive and saying they want a job) for every vacancy, up from 5.1 a year ago.
The number of people out of work and wanting a job rose by 148,000 (4.0%) between the May-July quarter of 2025 and the same quarter in 2026, while vacancies fell by 21,000 (2.9%) over the same period. This indicates that growth in the pool of job seekers accounts for more of the rise in the ratio than the continued weakness in hiring. Independent survey evidence also highlights the growing numbers of job seekers. The September KPMG and REC Report on Jobs data collected in August 2026 commented on the continuing rise in the availability of candidates, with total numbers growing at their fastest pace in three months.
On a more positive note, the ratio of people wanting a job for every vacancy does appear to have stopped rising. It has held steady at around 5.5 since the January-March quarter of 2026, having climbed steadily from a post-pandemic low of around 2.4 in mid-2022. Competition for each available job has stabilised but at a much higher level than in recent years. With vacancies at 702,000 in the June-August quarter of 2026, there is little sign of labour demand increasing sufficiently to offset the rise in supply.
Redundancies are starting to rise, following May’s spike in notified redundancies but the outlook is improving
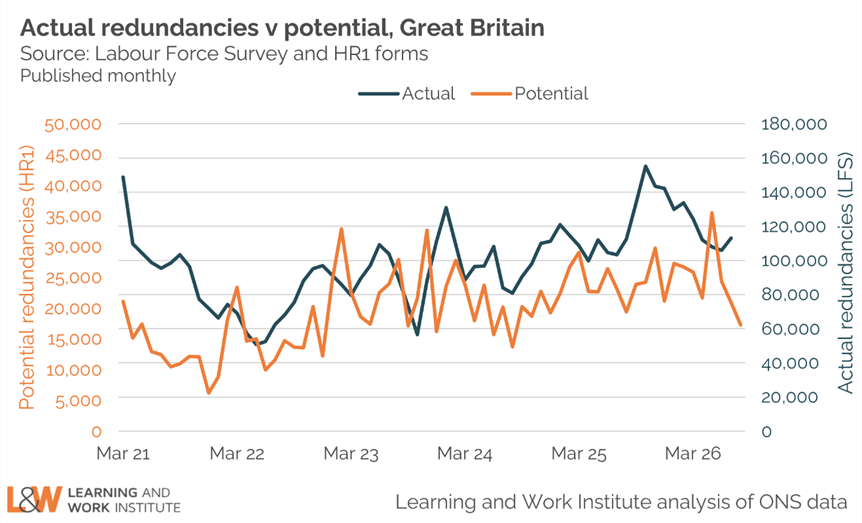
Employers are required to give the Insolvency Service advanced notice of any plans to make 20 or more employees at a single establishment redundant by completing an HR1 form. This gives an estimate of potential redundancies before plans are finalised. The minimum notice period required ranges from 30 to 45 days, depending on the number of employees at risk of redundancy. While there is no advanced notice of most redundancies, information from the HR1 form does provides an early indicator of a possible change in the labour market.
There was a sharp rise in the number of potential redundancies reported to the Insolvency Service in May 2026, Employers consulted over almost 36,000 potential redundancies at this point – around 20% more than in the next highest month over the past year (November 2025). The full effect of these planned redundancies may not have yet fed through to the measure of actual redundancies derived from the Labour Force Survey. However, redundancies rose to 113,000 in the May-July quarter of 2026, up from 103,000 in the same period in 2025. Recruiters also reported that the increase in the supply of job candidates was partly due to redundancies in the latest KPMG and REC, UK Report on Jobs. The good news is that the numbers of planned redundancies have fallen since May. On a rolling three-month basis, potential redundancies peaked at 27,700 in March-May 2026, but dropped to 20,900 in June-August, 9.3% below the same period a year earlier.

Retail and hospitality continue to show signs of weakness
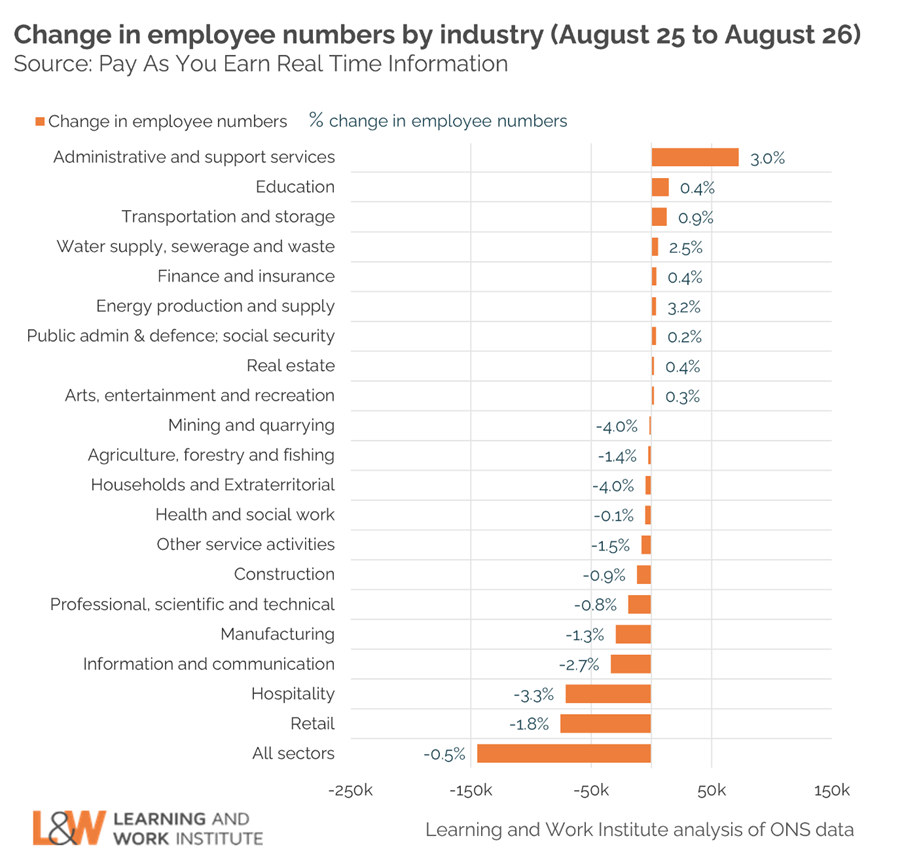
As in previous months, HMRC’s PAYE data shows differences between industries beneath the overall fairly ‘flat’ picture. Employee numbers fell by 145,000 across all sectors in the year to August 2026, with retail and hospitality accounting for the largest share of the reduction: down 76,000 and 71,000 respectively. By contrast, administrative and support services grew by 3.0% and it experienced the largest increase in the number of employees in any sector (72,000).
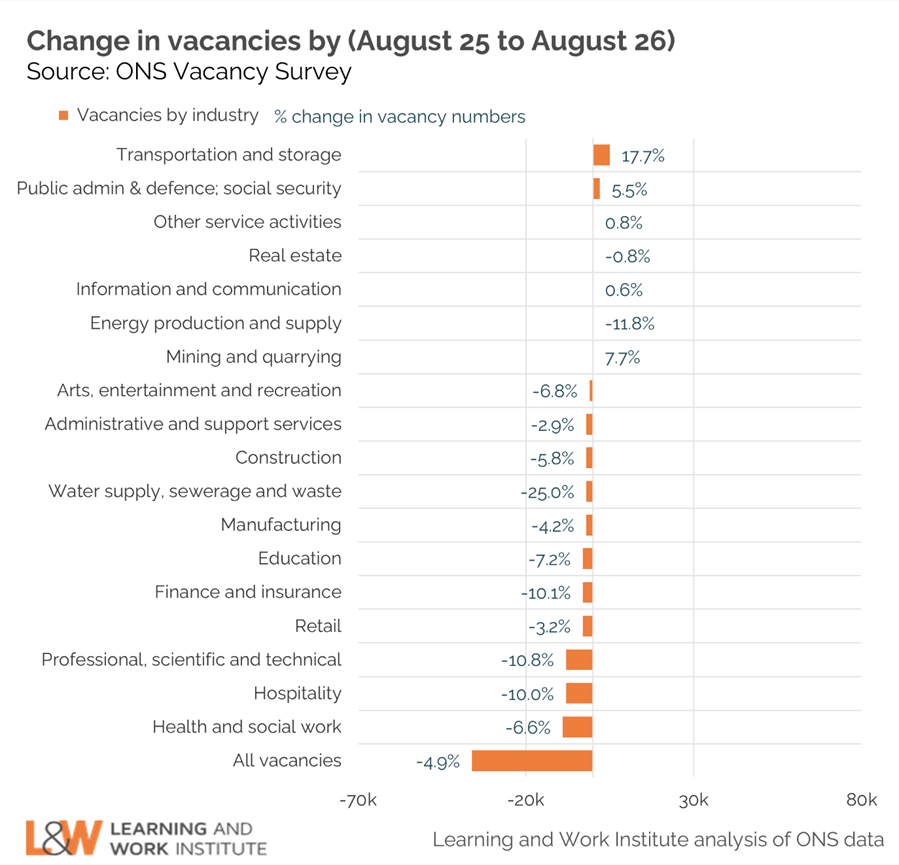
While hospitality has experienced one of the largest reductions in the number of vacancies over the past year (a reduction of 10.0%, or around 8,000 vacancies), there has been much less change in the number of vacancies in the retail sector (a fall of around 3,000 vacancies, or 3.2%). The Health and social work sector recorded the largest fall in vacancies of any industry, down by 9,000 (or 6.6%). Professional, scientific, and technical activities also experienced a sizable decline in vacancies – down by 10.8% (or 8,000 vacancies) over the past year, pointing to weaker demand for higher skilled roles. Overall, vacancies fell by 36,000 between the June-August quarter of 2025 and the same quarter in 2026.
Real pay is (slowly) rising, but only in the public sector
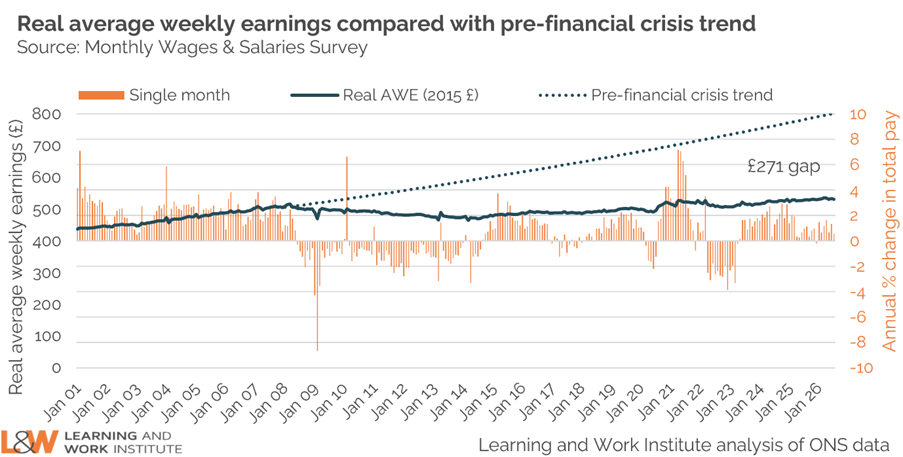
Inflation rose from 2.8% in June 2026 to 3.1% in July. The Monetary Policy Committee expects that rising energy prices will continue to put upward pressure on wages in the short term – but that the slack in the labour market will act as a counterweight in the longer term. Average regular weekly earnings in July 2026 were 3.5% higher than a year ago. In real terms, adjusted using the Consumer Prices Index including owner-occupiers’ housing costs (CPIH), regular pay grew by 0.6% over the year.
This modest increase in wages after adjusting for inflation is driven by rises in the public sector, where regular pay grew by 6.3% against a 2.9% increase in the private sector. This is partly due to NHS staff receiving a pay rise earlier in 2026 than was the case in 2025, so this gap is not expected to persist. Overall, real average weekly earnings remain £271 a week lower than they would have been if the pre-2008 financial crisis trend had continued.
Health is a major reason people cite for being out of work – but the Government’s flagship programme to get more people back into the labour market has been slow to mobilise
Last month, we showed you the latest data on the disability employment gap: despite a major policy focus on this area, the gap between the employment rates of people living with and without a disability has barely changed since before the pandemic and currently stands at 29 percentage points.
This month, we have some data which highlights the challenges the Government has experienced in trying to close that gap.
‘Connect to Work’ is the flagship programme (originally announced under the previous Conservative Government under the name ‘Universal Support’) designed to provide intensive support for people furthest away from the labour market – primarily for health-related reasons– to find and sustain employment.
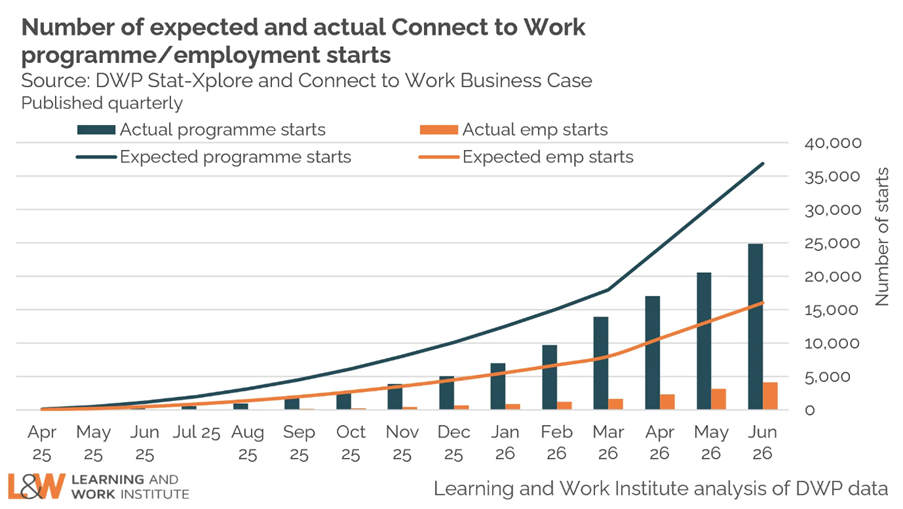
The latest data shows that, between the programme launching in April 2025 and the end of June 2026, around 25,000 individuals started on Connect to Work – a target that the Government originally expected to exceed in the first 12 months of delivery. Earlier this year, the Government revised down its estimates, but participants numbers are still well below where those new forecasts say they should be.
The mobilisation challenges faced by Connect to Work were coherently outlined in a Work and Pensions Select Committee report in June. There was an inherent tension between the programme’s two core principles: fidelity to two specific, evidence-based models of ‘supported employment’ on the one hand, and devolved commissioning and delivery on the other. The latter points to a new, more collaborative way of working – but the former probably encouraged DWP officials to take a more prescriptive approach.
A ‘clunky and unsatisfactory’ mobilisation process was the result, as DWP worked out in real time how to manage these tensions in its dealings with local authorities. Many of the delivery ‘clusters’ were new to commissioning this type of programme and/or new to working together – but still had to try and mobilise quickly. Challenges recruiting specialist staff and inconsistent administrative geographies have also been cited as early issues.
That tells us why the programme was slow to get going – and why the Department chose to revise down their delivery estimates. But it doesn’t tell us why the programme is still off-track. We’ve heard rumblings that some providers might consider the contracts for these intensive support programmes undeliverable for the money on offer – and that competition for referrals remains an issue in spite (or maybe because) of the voluntary nature of Connect to Work. Engaging people in services, rather than relying on referrals, is a key challenge of any voluntary programme – one our hyper-local JobsPlus model seeks to address.
There’s also a silver lining here. The early travails of Connect to Work provide an excellent illustration of the gap between ‘what works’ and ‘making it work’; between policy and delivery. And in particular, it shows just how long a journey DWP needs to go on to make Andy Burnham’s employment support devolution plans a reality. The faultlines, failures and lessons of the Connect to Work rollout should provide a very immediate set of guidelines to DWP as they move towards quite a different role in the employment support landscape.
The rise of ‘tick box’ training is keeping the UK workforce stagnant
Employer investment in training has fallen by almost a third since 2011. The final report of our multi-year research project digging into the why and wherefores of this productivity-draining phenomenon was published last week.
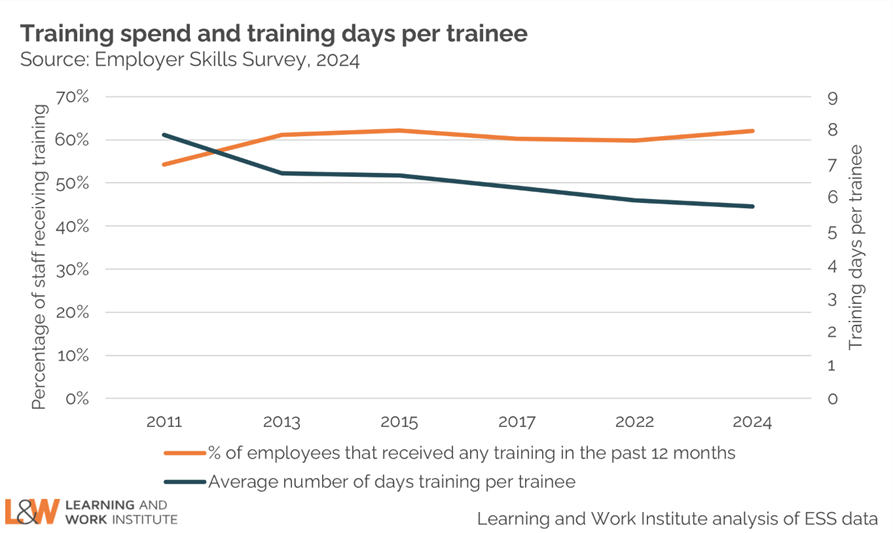
Our analysis shows that training has maintained the same breadth across the labour market but lost significant depth. The proportion of employees participating in training each year has remained relatively high at 60%, but training has got shorter, falling from 7.8 days per trainee in 2011 to 5.7 days in 2024. The UK stands out on this internationally, with the highest proportion of training episodes that last less than one day.
What is going on here, what does this mean, and what can we do about it? Take a look at our report, and keep your eyes peeled for insights and recommendations from this programme in the coming months.