


Every month, Learning and Work Institute produces detailed and timely analysis of the latest labour market statistics from ONS. We examine what the figures tell us both about the health of our labour market, and what they mean for people’s experiences of work, with a particular focus on groups facing labour market disadvantage. Become a supporter to receive our monthly briefing delivered directly to your inbox and navigate our labour market dashboard.
June 2026
Stephen Evans, Chief Executive at Learning and Work Institute, said:
The labour market remains fairly flat overall, but with some worrying signs. One in three young people not in full-time education are not in work either. Following the Milburn Review this further confirms the need for urgent action to support young people who are not in education, employment or training. Employment is fairly flat overall, but with 220,000 fewer people working in retail and hospitality than two years ago and the main growth in health and social work (up 90,000).
We can kick off today with some tentative good news from earlier in the week: inflation has unexpectedly held steady (rather than rising, as predicted), and it looks like the war in Iran may be drawing to a close.
That does not mean all is well in the economy: inflation is still above the 2% target we were expecting to return to, and the global situation remains uncertain (with business confidence likely to respond accordingly). But it does mean that this latest shock has left us in a state of malaise, rather than a deepening crisis.
Today’s employment stats – which predate these latest developments, taking us up to April – continue to demonstrate that stagnation. The numbers have not changed much over the last quarter, but the trend over the last year is clear: flat employment levels, with a small (but distinct) rise in unemployment and a commensurate fall in economic inactivity.
The labour market is sluggish: vacancies are down, job-to-job moves have been flat over the last year (and are lower than pre-pandemic). No industry appears to be particularly thriving from an employment perspective, and the struggles in hospitality and retail are continuing.
As we’ve previously said in this briefing, young people entering the jobs market for the first time are the first to be hit when organisations stop hiring. Alan Milburn’s review has got the nation talking about youth employment again. So, at the end of today’s briefing, we have included some of the morsels of data from the Milburn report that help paint a wider picture of the issues NEET young people are facing: lack of access to support, long periods with no work at all, and low qualification levels.
In an attempt to inject something novel, our Labour Market Data Whizz (AKA Lovedeep Vaid), has had some serious fun with the flows data this month. We hope you like the ‘planets’ viz, but we’re always looking for suggestions – so let us know!
The employment stats are still just flat
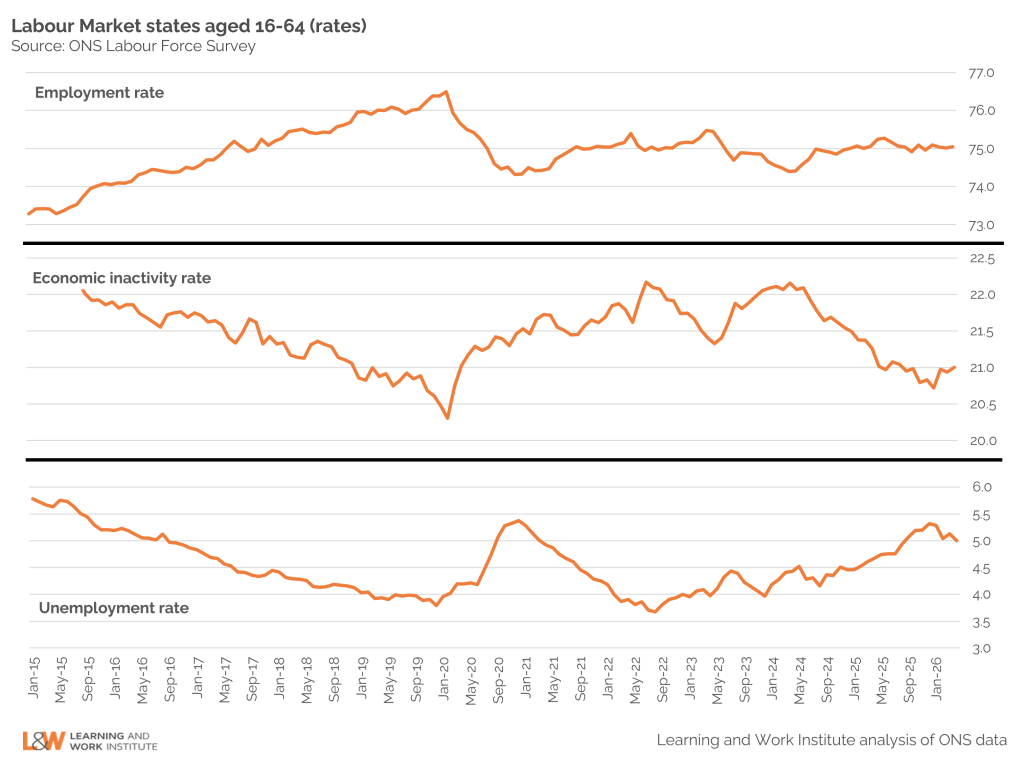
The headline employment stats from the labour force survey have remained essentially flat once again. The bump in unemployment up to 5.3% in the winter has flattened out again to 5% – with a small rise in economic inactivity making up the difference – but is still elevated above 2022 levels.
The PAYE data shows a similarly flat picture. The large drop in employment between March and April from last month’s release has been revised to half the previous estimate, but is still showing a 50,000 decline. This still doesn’t paint a picture of crisis, but of malaise.
But it’s getting harder out there. For every vacancy, there are 5.5 people wanting to work – up from 4.7 a year ago.
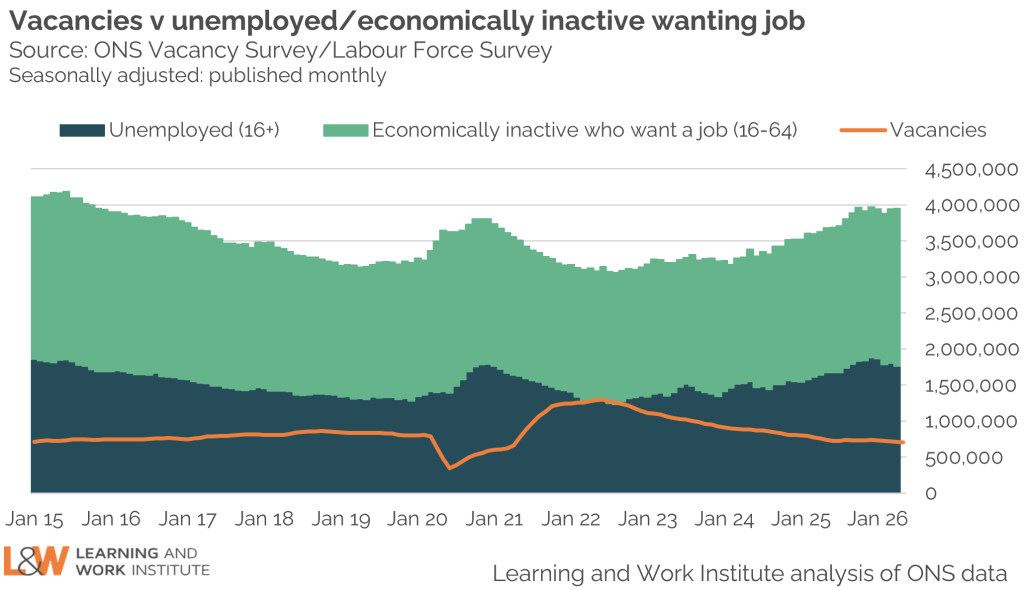
The data continues to show a tough environment for job seekers, with rising competition for jobs.
The latest data shows vacancies continuing to fall steadily: down to 707,000 in Mar-May – down from 725,000 the previous quarter and 759,000 the previous year. Meanwhile, the number of people out-of-work but wanting a job (whether unemployed or economically inactive) has risen slightly.
That means there are now 5.5 people out of work wanting a job for every vacancy. But of course, those individuals will be facing a very different situation, depending on what kind of job they are looking for – and where.
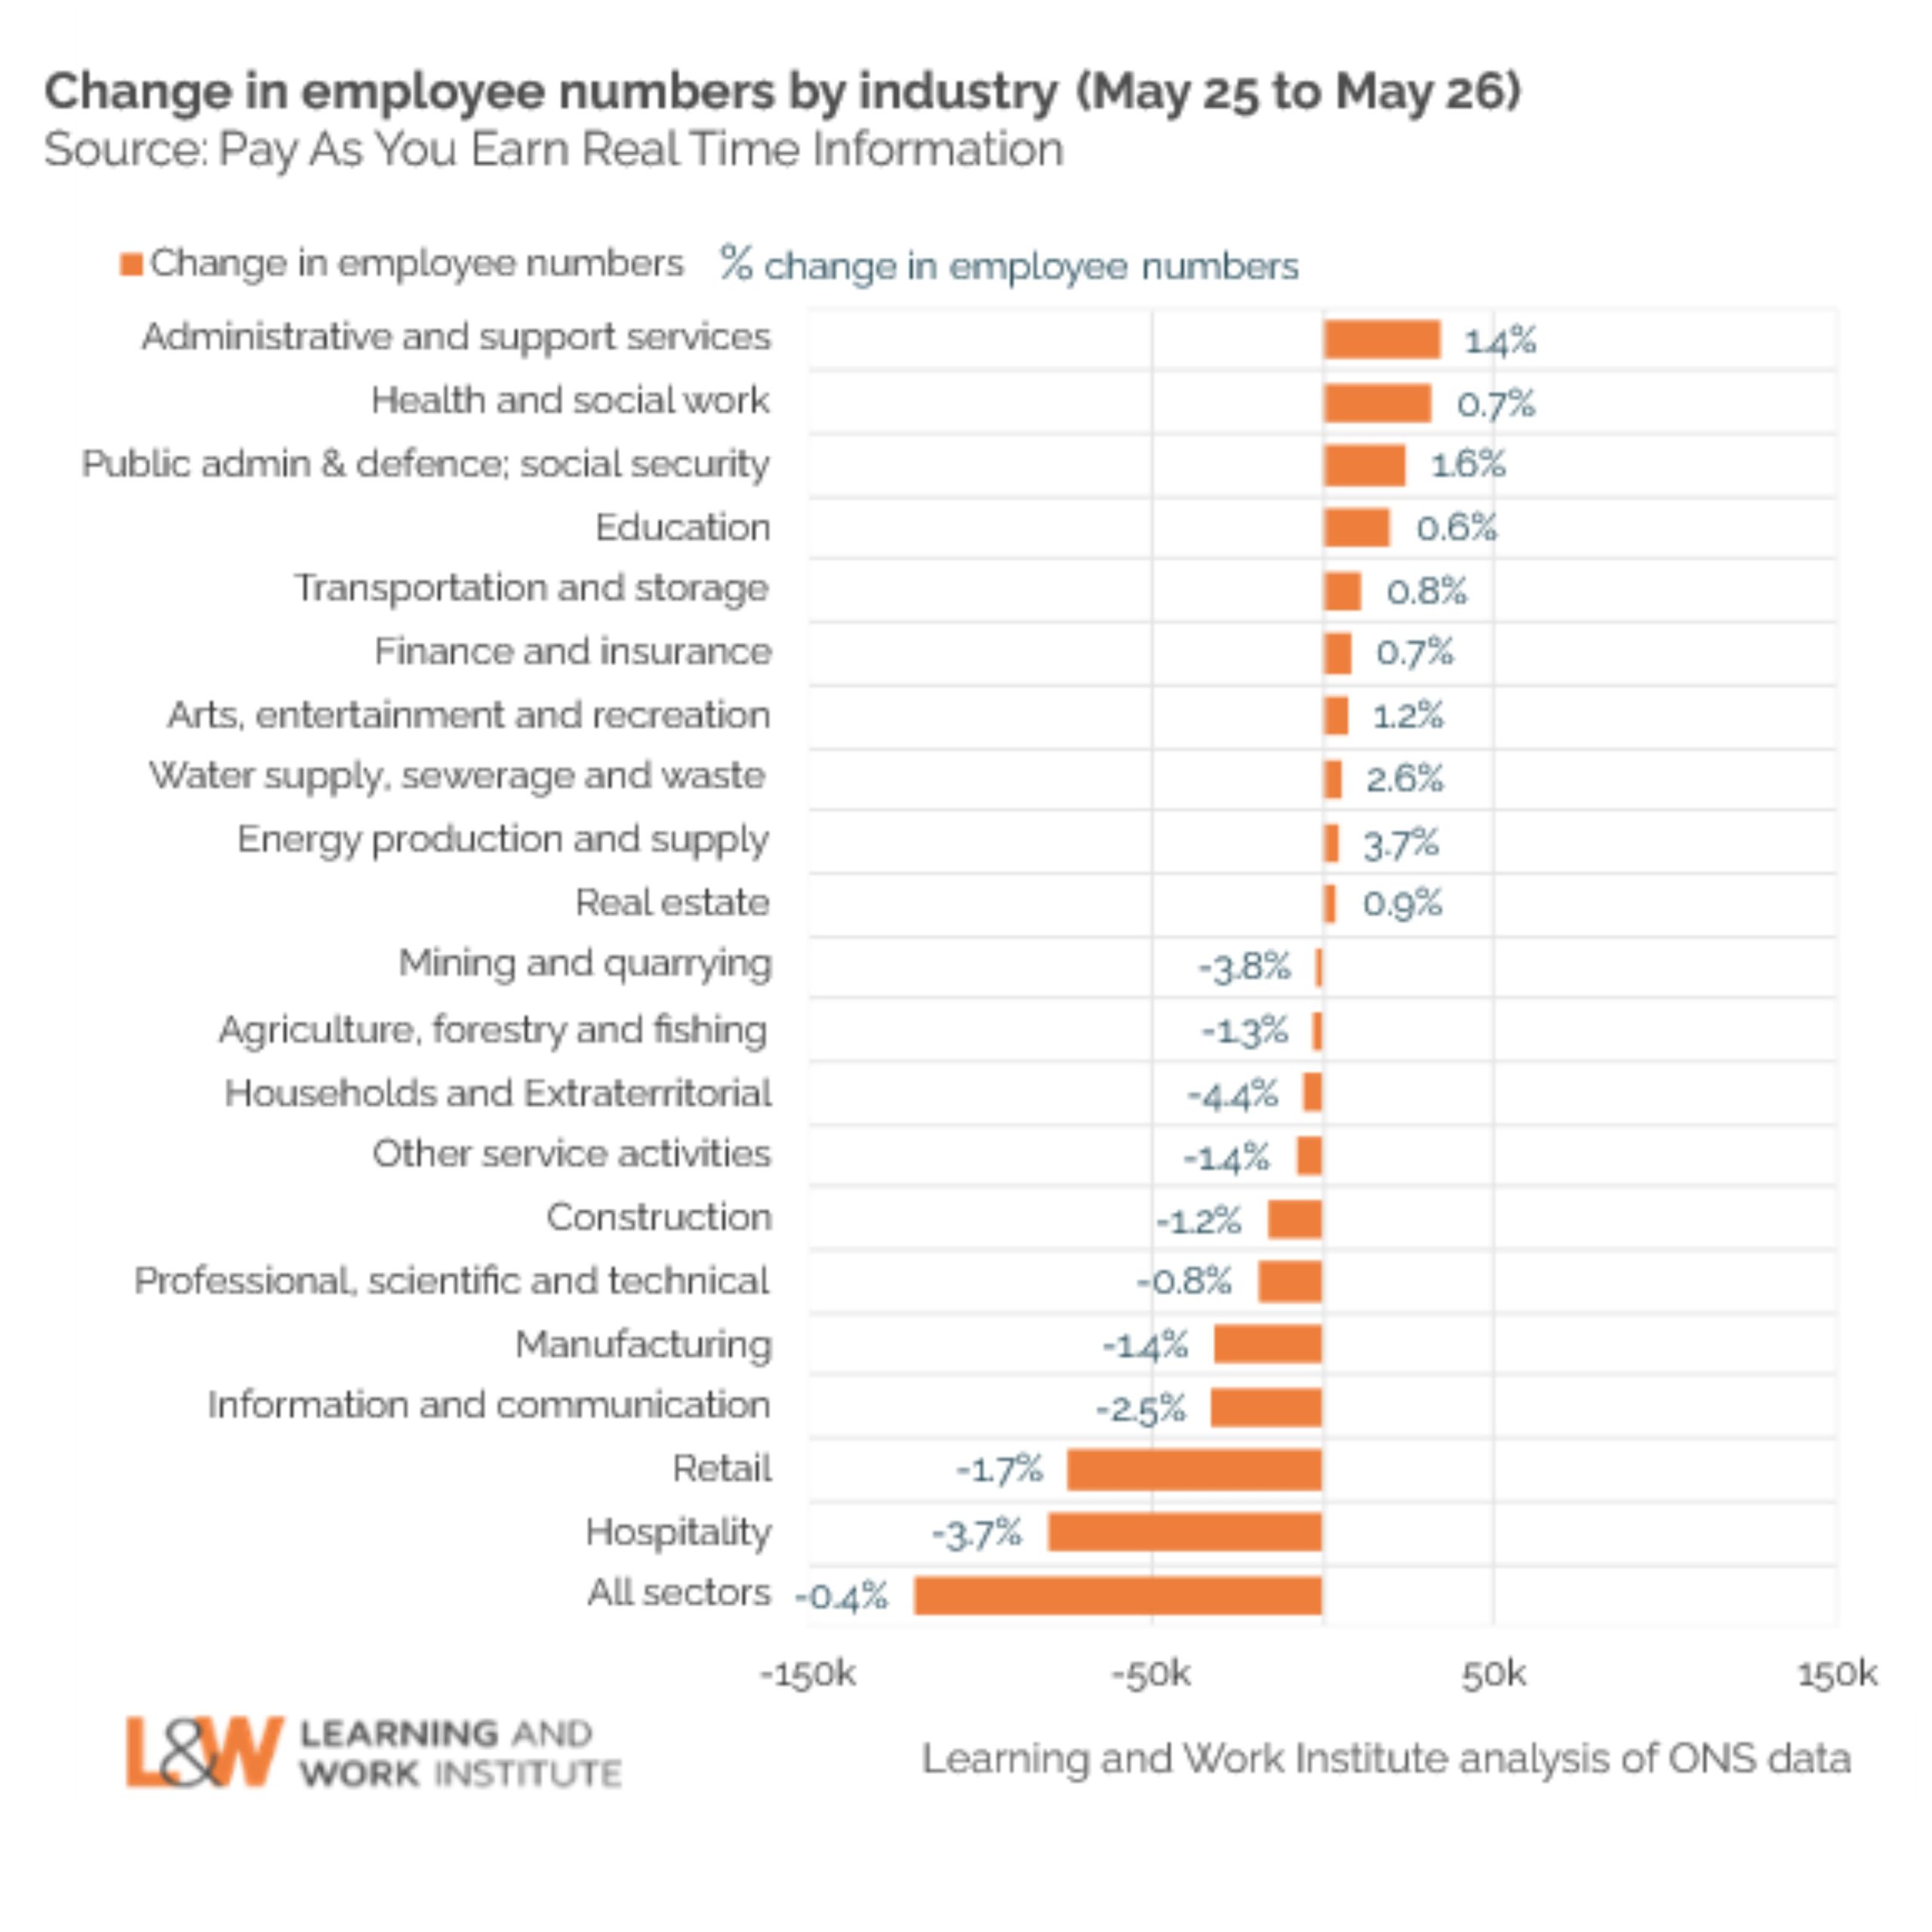
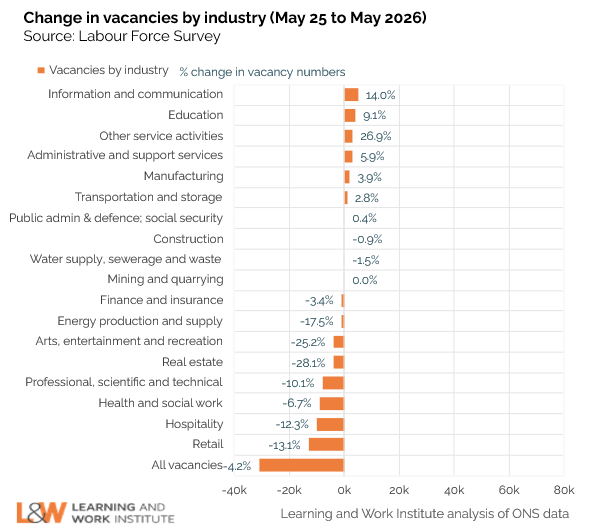
There are 154,000 fewer people working in retail and hospitality than there were a year ago
Employment in hospitality and retail have continued to fall in the last year: by 154,000 people, representing a drop of 3.7% and 1.7% respectively. They have also seen the largest drop in vacancies in numerical terms, with a 12% and 13% respective fall. These are also the sectors (other than the public sector) with the highest wage growth over the last year – likely due largely to the rise in the minimum wage, the costs of which may also be responsible for some of this contraction in employment. April’s monetary policy committee report noted that those exiting jobs in the hospitality sector in particular faced rising rates of unemployment – suggesting that workers from these sectors were finding it particularly hard to move into jobs elsewhere.
Health and social work has reliably held the top of the pack in employment growth over the last year, but that is now slowing. There are nearly 32,000 more people working in this sector than there were a year ago (in a workforce of 4.5 million), but that growth has allowed in recent months. Vacancies in this sector are down 6.8% on last year, suggesting this flattening off is likely to continue.
Administrative and support services – a bit of a mixed category including travel agents, recruiters, facilities support, security and call centres – has seen the strongest employment growth in the last year, up 34,000 (1.4%). Interestingly, this category contains jobs highly exposed to AI (call centres) and those more protected (facilities).
Fewer people are moving jobs than three years ago
Another way to understand how gummed up the labour market is, is to look at how people move around it: between jobs, into and out of unemployment, etc. This flows data is noisy, but does paint an interesting picture.
First off, here is what happened between the end of 2025 (Oct-Dec) and the beginning of 2026 (Jan-Mar).
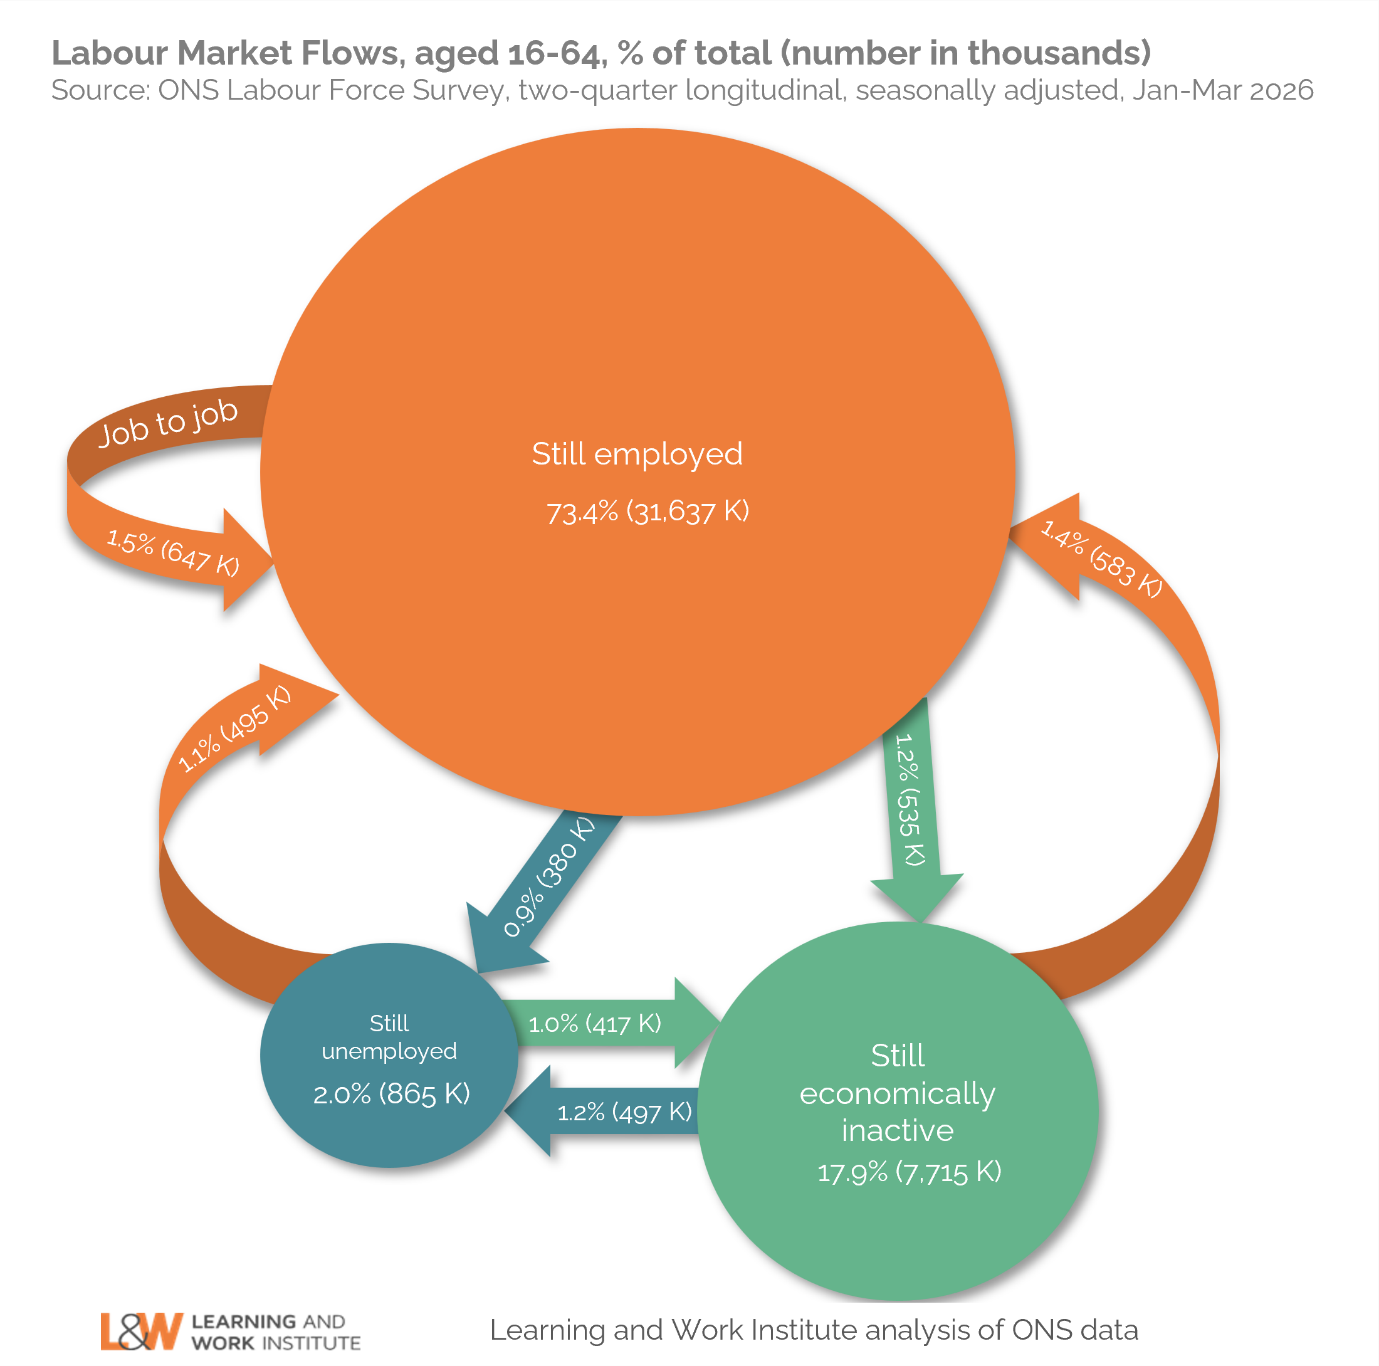
The most important thing to note is that most people stay in the same place. In this quarter, 93.3% of the 16-64 population stayed in the same employment situation (the same job, or remained unemployed or inactive) they were in in the previous quarter. But that still means that nearly 7% – 3.5 million people – experienced some kind of change, including 1.7 million starting a new job.
In that wider population-level context, the proportion of people moving about from one group to the other are not that dissimilar to one another. But there have been changes over time, which we can see if we roll up the data into four-quarter averages.
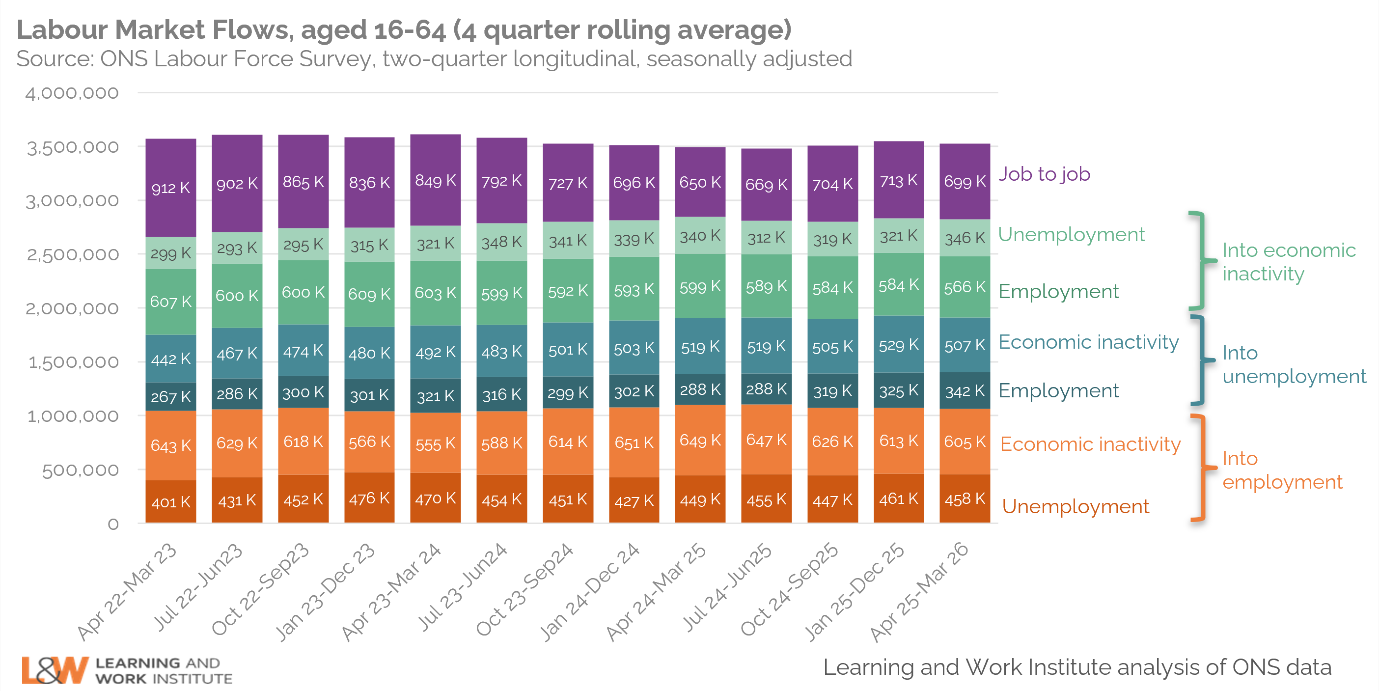
There is one clear change over time we can see here: the number of people moving jobs. There was a substantial amount of movement around the labour market in the immediate aftermath of the pandemic, and the average number of job-to-job moves each quarter has fallen since then. But this number has continued to fall, and is now below levels in 2019/20. Here is one of the other clear signs we have of a sluggish labour market.
This chart also reminds us that most of the people becoming ‘unemployed’ have not actually lost their job – a larger proportion of them move from the category ‘economically inactive’. That meant they went from being unable or not wanting to work to actively seeking a job (but not having one). In the year to March 26, an average of 849,000 people every quarter moved into the ‘unemployed’ category – but of those, only 40% were previously employed. The number of people becoming unemployed has risen in the last three years, but the split of where they come from has remained consistent.

The latest inflation numbers are good for people’s pockets – but the long-term picture on wages remains bleak
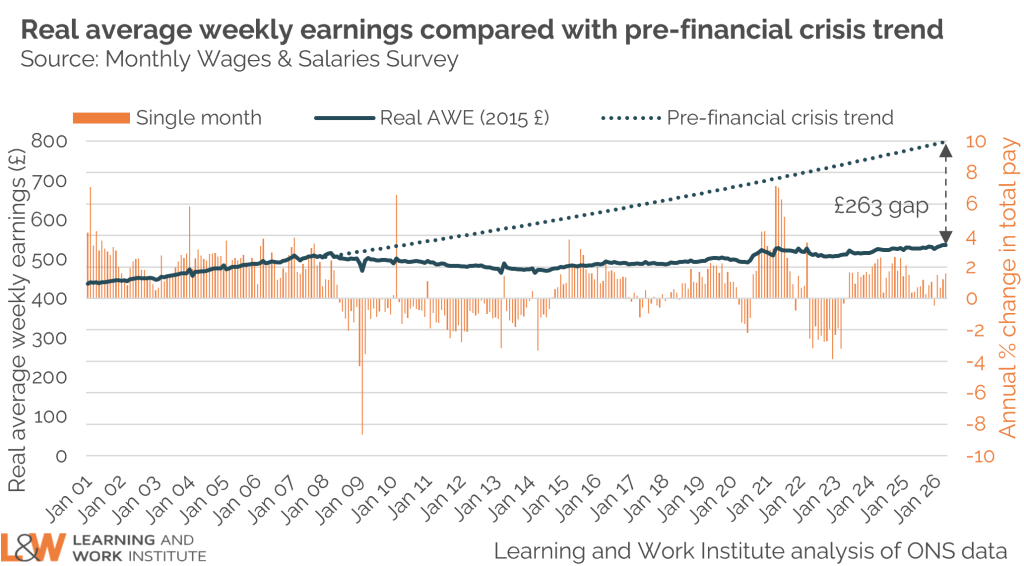
Real regular pay growth was up by just 0.1% in the year to April 2026 – but the picture varied in different parts of the economy. Nominal public sector pay growth was up 5.1% in the public sector, but only 2.9% in the private sector. And overall average earnings are £263 below where they would have been had we stayed on our pre-financial crisis trajectory.
There are still over a million young people who were NEET
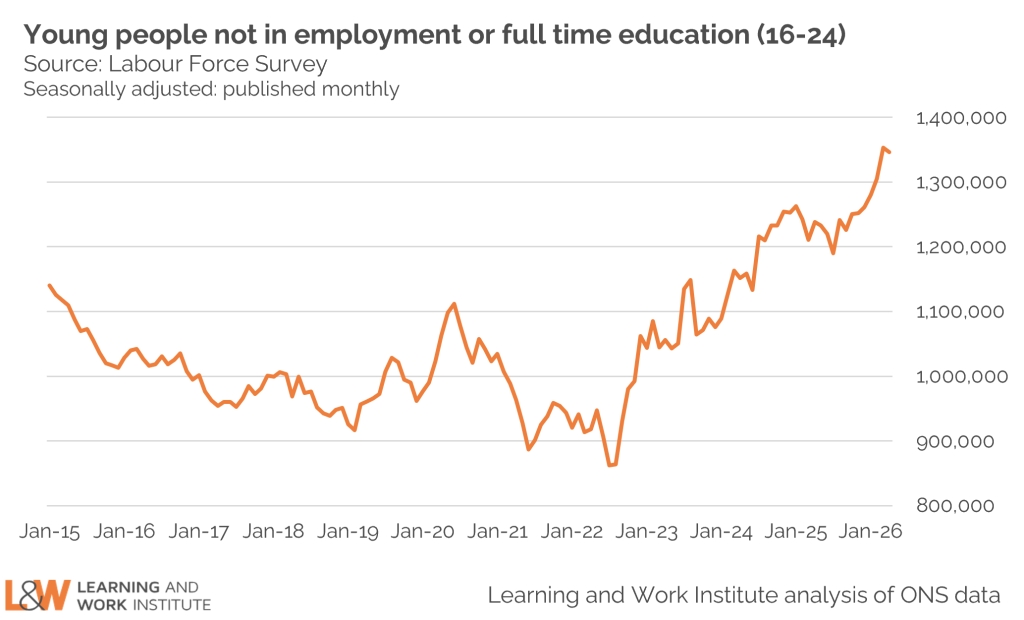
The number we track regularly is the number of young people not in employment or full-time education (the usual NEET number excludes those in part-time education as well). Here, the numbers remain at an elevated 1.3 million. But the real concern is not just how many young people there are who are outside of the work and education systems – but how few of them are being reached by Government support.
The proportion of NEETs being reached by the Youth Guarantee may be as low as 1 in 5
As L&W did last year, the Milburn review team has tried to Frankenstein together different bits of data to try and work out how many young people are interacting with the benefits system, and – if they’re not – what might be happening with them. This latter group have been termed the ‘hidden NEETs’: the group that is currently outside of the reach of the key institutions we use as gateways to further support.
Around half of NEET young people (age 18-24) are claiming some sort of benefit. But even within that group, only 1 in 5 is in the Universal Credit ‘searching for work’ group – which is the group targeted for most employment support interventions (including those rolled out under the Youth Guarantee). That means that – according to this estimate – 4 in 5 NEET young people (in England) are at risk of receiving no support whatsoever.
That does not mean that they are definitely not receiving any support. The Youth Guarantee trailblazers are delivering employment support outside the benefits system, as are other services funded by charities or even some regional authorities that did not receive this dedicated funding. We will soon be publishing our evaluations of two of these trailblazers. But this is not a national programme, and there are many places without provision – meaning many young people falling through the gaps. As Alan Milburn put it in the report: “There are institutions, programmes and many good intentions. But there is no actual system.”
60% of NEET young people have never worked
Even a short spell of unemployment under 25 has a scarring effect on future employment prospects and earnings – but these effects get stronger the longer a young person spends out of work. A recent longitudinal study looking at a group of people who had been NEET in the late 80s/early 90s found that the impacts of this early workforce detachment persisted into middle age.
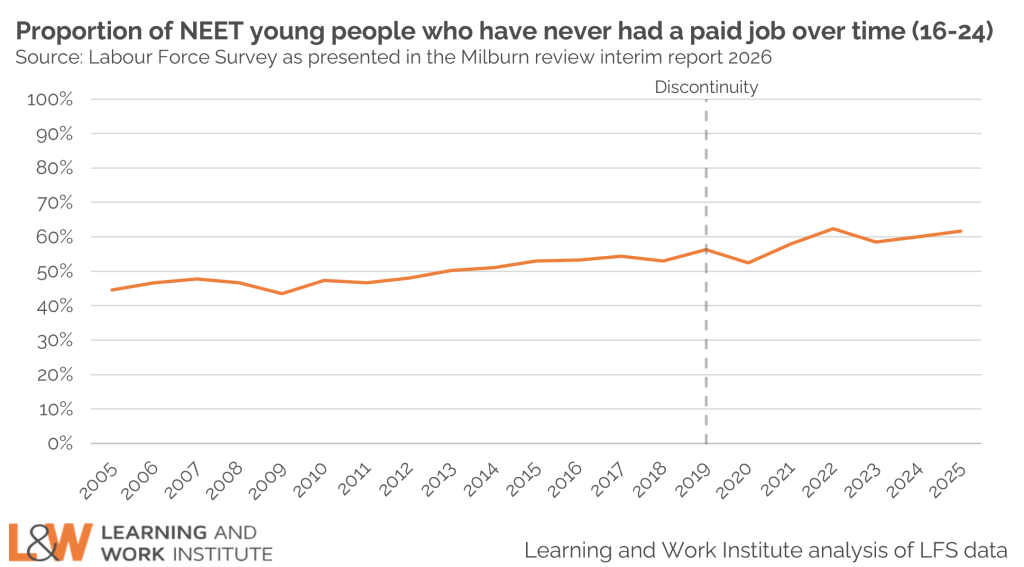
So it’s very concerning to see that the proportion of NEETs who have never worked has been rising since the financial crash of 2008 and is now 5 ppts higher than in 2019 (pre-Covid).
And this is not just concentrated at the younger age groups. As our previous research showed, 45% of NEET young people age 22-24 have never worked.
16% of NEET young people have a degree – but 18% have no qualifications at all
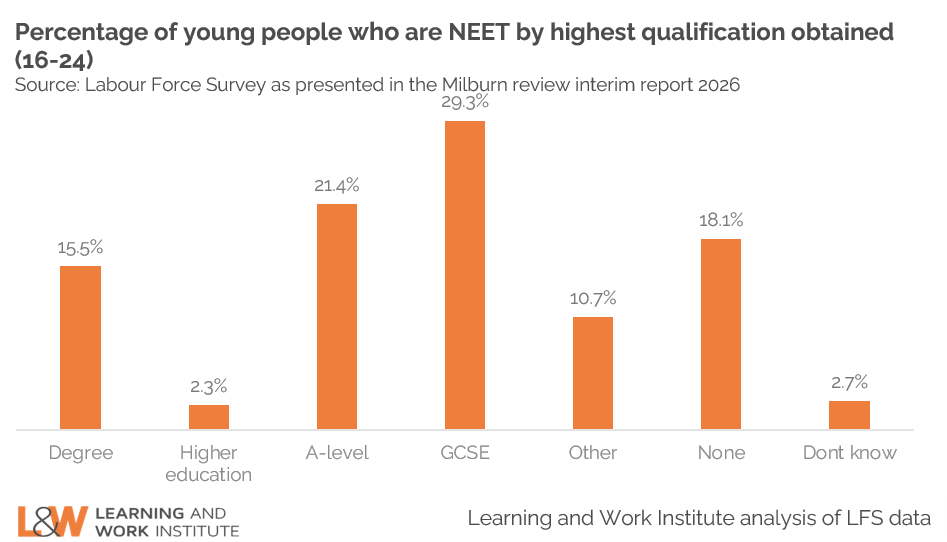
Finally, we found this data quite interesting – showing the highest qualification level of NEETs. Much has been made of graduate unemployment in recent reporting, and this is clearly a rising issue: 13% of NEET 21-24s in 2025 had a degree, compared with 9.5% in 2015. Entry into HE has been growing in this period – meaning there are more graduates – but at a slower rate (31% of 18-year-olds entered HE in 2015, compared with 36% in 2025).
But it’s worth remembering that the NEET cohort is mostly dominated by people who do not have a degree. For 29%, GCSEs are their highest qualification, while 18% have no qualifications at all. This is partly due to the age range considered (16-24) – of those young people will go on to get a higher qualification. But this is a reminder that the NEET issue is not simply an employment one. The Milburn review focused heavily on routes into work, but routes into training and education (and support for young people to thrive in those environments) will be a crucial foundation. Those young people don’t just need a job, but support boost their skills and qualifications – and with that, the opportunities open to them across their lifetime.