



Every month, Learning and Work Institute produces detailed and timely analysis of the latest labour market statistics from ONS. We examine what the figures tell us both about the health of our labour market, and what they mean for people’s experiences of work, with a particular focus on groups facing labour market disadvantage. Become a supporter to receive our monthly briefing delivered directly to your inbox and navigate our labour market dashboard.
October 2026
Stephen Evans, Chief Executive at Learning and Work Institute, said:
The labour market remains relatively flat overall. This resilience in the face of headwinds driven by global events is welcome. But underlying problems remain, with around one million young people not in education, employment or training and overall employment more than two million short of the Government’s 80% employment rate target. To fix those challenges we need to change the benefit system so it offers active help to all who need it, but also make it easier for employers to create jobs.
Another month with another pretty flat picture in the employment stats. There are undoubted challenges in the global economy, so the continued ‘flatness’ of the UK labour market is a not unwelcome sign of resilience.
However, this stability will feel like stagnation to those who are currently out of the labour market and trying to get in: the 5.3 people who want to work for every available vacancy, including the young people who are looking for an entry point into the world of work. And it puts the Government’s ambitions of an 80% employment rate further out of reach.
The ‘flatness’ of the labour market is something that comes across consistently in the data: it appears in the headline employment rate and in the PAYE employee numbers. But it’s becoming clearer that the non-response issues faced by the Labour Force Survey have impacted our understanding of the true state of the labour market – as well as our estimation of the productivity challenge. So we’re digging into those numbers a bit today.
Did you read this and think: “this looks cool, I could do this, I would love to work with the people behind these zippy charts and informed-yet-lively analysis?” We’ve currently got vacancies for a Head of Research and a Research Intern (who will work on data, including charts like these). Deadlines fast approaching, but there’s still time to apply over the weekend.
The headline employment stats have changed little over the last two years
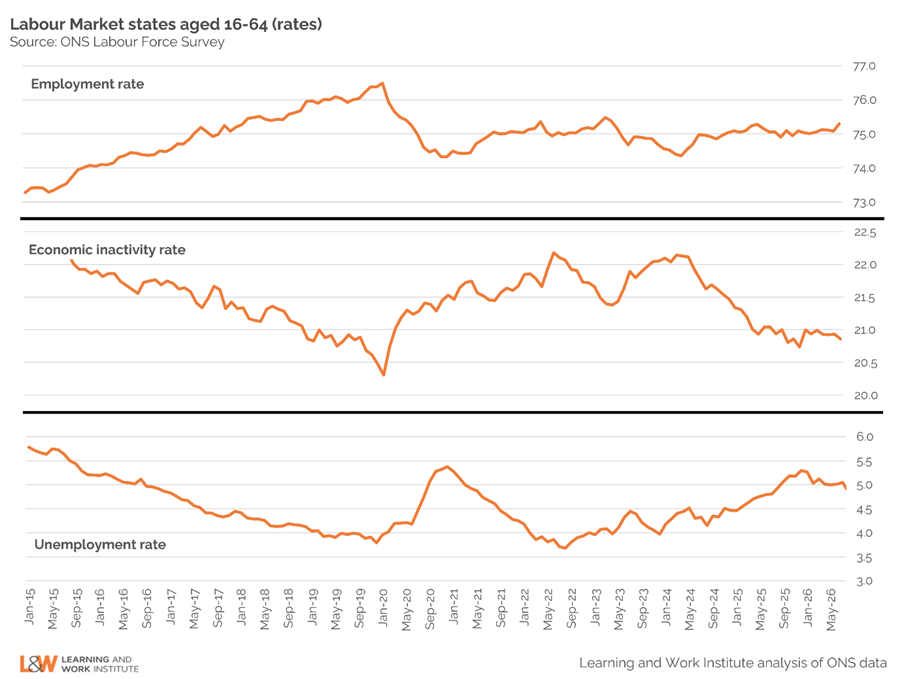
The headline employment rate was 75.3% in Jun-Aug this year, barely changed since the previous quarter (75.1%) the same time last year (75.1%) and the year before that (75.0%). While unemployment is appreciably higher than it was two years ago (now 4.9%, up from 4.2% in the same quarter in 2024), this indicator has also levelled out over the last year. The economic inactivity rates tell a similar story – a marked reduction between the Jun-Aug quarters of 2024 and 2025, followed by stability in the period to Jun-Aug 2026.
How confident can we be about the story of change that the Labour Force Survey (LFS) is telling? The LFS is notoriously troubled – with low response rates since the pandemic creating greater uncertainty in the numbers. Administrative data, drawn from HMRC’s PAYE system, misses out some key parts of the labour market (ie. the self-employed) but does give us more direct access to what is happening to people who are on payrolls.
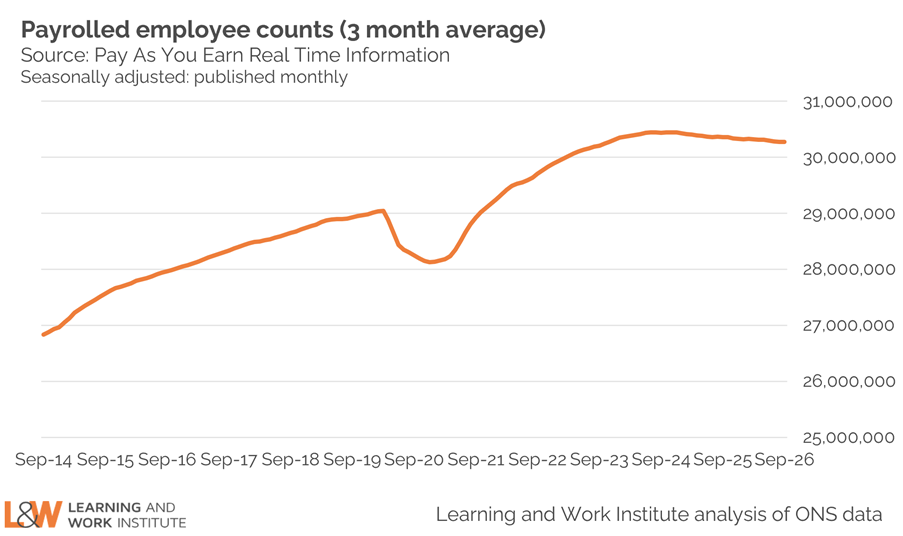
This data shows the same fairly ‘flat’ story over the last couple of years: payroll employment has fallen by just under 66,000 over the last year (comparing September 2026 to September 2025), but in the context of more than 30 million jobs, that is only a 0.2% change.
The bigger divergence comes when we look at the longer-term picture: and particularly try to work out what has happened since Covid. When we show together the LFS employment rate, and an adjusted employment rate derived using the administrative data (we base our methodology on one developed by the Resolution Foundation) we can see the difference. The Labour Force Survey shows employment stagnating after a small post-pandemic recovery, with a dip in 2023/24. The adjusted trend shows a much stronger post-pandemic recovery – but one that subsequently faltered in recent years.
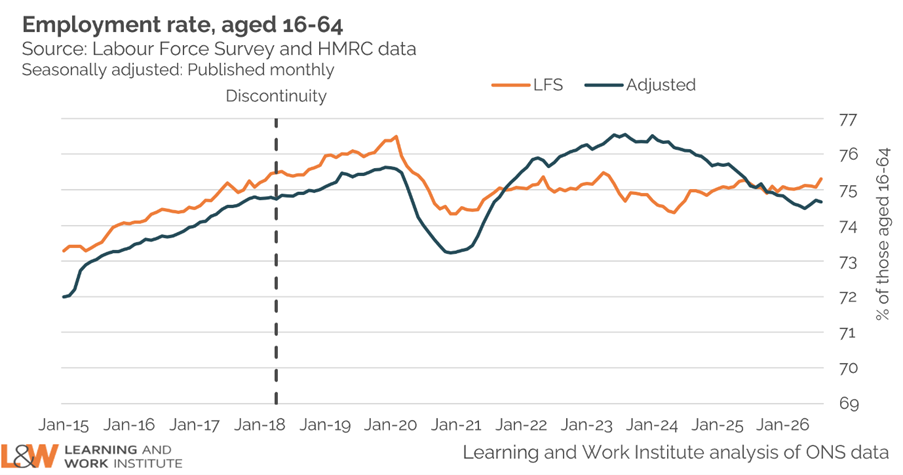
This is not just nerdery – having an accurate picture of the health of our labour market (and by extension, the economy) is key to helping politicians prioritise where and how to intervene in a complex and straightened landscape. If we better understood the ‘productivity puzzle’ (seemingly less a result of slowing improvements in output per workers, and more on shrinking hours) would we have invested in ‘Help to Grow’? If we hadn’t seen such a precipitous rise in economic inactivity in the years following the pandemic, would attention have turned more quickly to youth employment? That is not to say we would have been in a better world now – but different choices for priority actions might have been made.
We’ve known all of this for a while (and been producing our adjusted series for nearly 2 years). But we’re revisiting it today, because the LFS has been back in the news (for people who pay attention to such things…). The ONS team have produced an excellent blog outlining their own experiments with combining administrative and survey data – cautioning that this does also not currently tell the ‘truth’ about what is happening in the labour market.
So we need to look at the numbers beyond the headlines. And this is giving us a clear picture: a flat labour market, with challenges for anyone trying to find their way in, and particular issues in the private sector.

Vacancies are continuing to fall, and there are 5.3 people out-of-work and wanting a job for every 1 of them
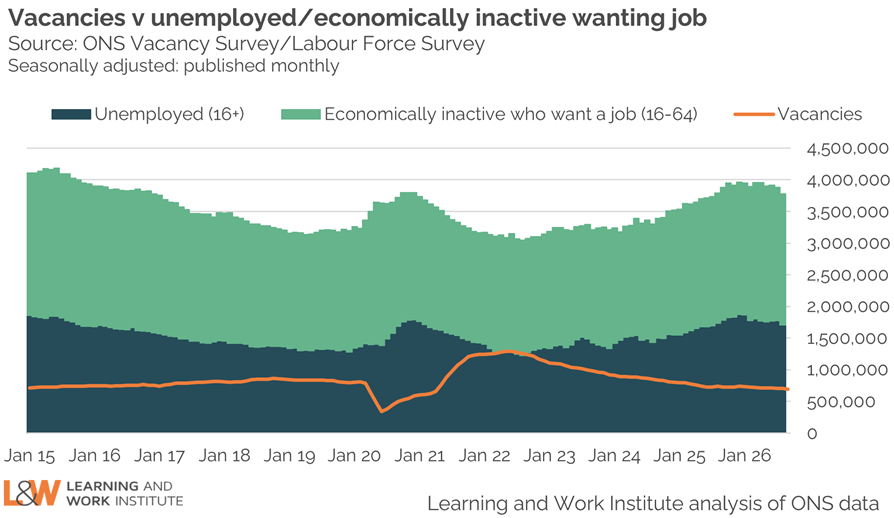
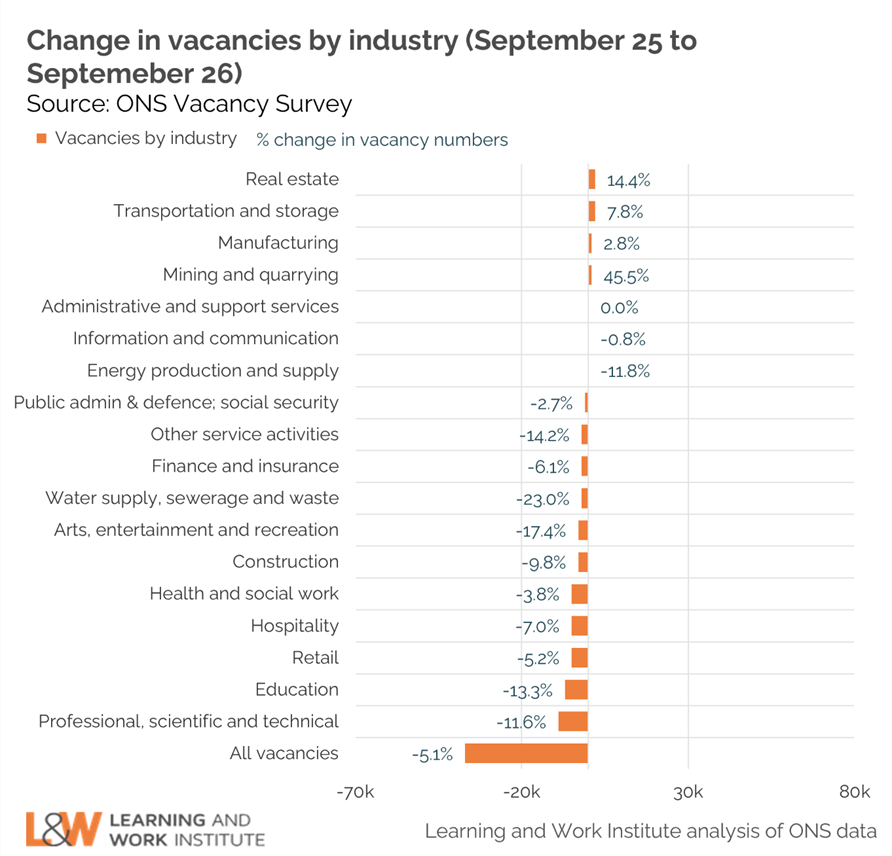
Vacancies dropped below 700,000 in the July to September quarter of 2026 – down to 691,000 (the lowest level in over a decade). This is following a slow but continuous decline in vacancies since the post-pandemic peak of nearly 1.3 million in 2022. The post-pandemic era was marked by exceptional levels of movement in the jobs market, but there has been a clear turning point: prior to the early 2020s, vacancies were steadily climbing, now they are steadily falling.
This is why things feel so hard for people looking for work: there are 5.3 people who are out-of-work and wanting a job for every vacancy. That does not include people who are in work and wanting a new job – the main route to a potential pay rise in an era of low wage growth (particularly in the private sector). And of course, that competitive environment is particularly hard for young people who cannot demonstrate their prior experience in the labour market.
The number of young people out of employment and full-time education is higher in 2026 than they have been since 2013
There are currently 1.28 million young people who are not in employment or full-time education (higher than the headline ‘NEET’ number, because that excludes young people in part-time education). That represents a slight fall over the last few months (from a peak of 1.35 million in the January to March quarter of 2026) but means that numbers remain at their highest level since 2013.
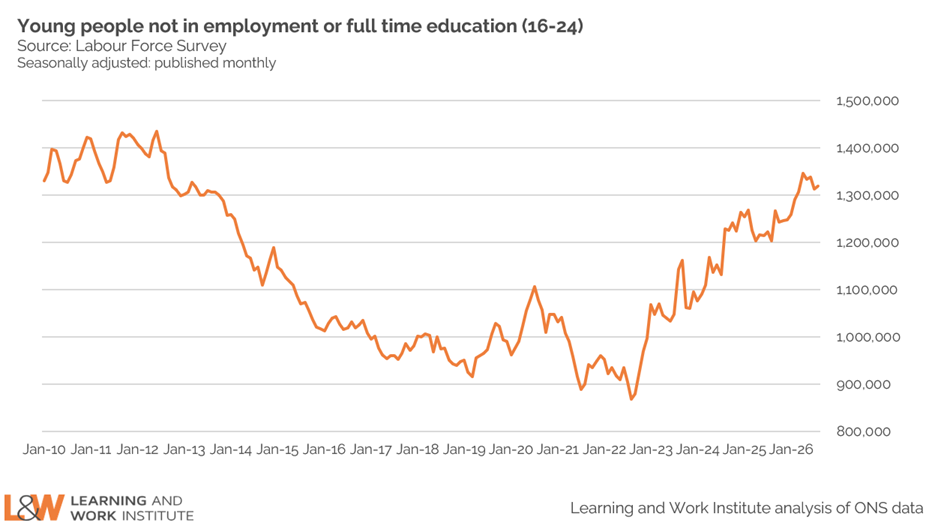
The current Government has launched a number of programmes and initiatives to tackle this over the last two years, including most recently the extension of the subsidised ‘Youth Jobs Guarantee’ to young Universal Credit claimants who are out of work due to ill-health. But we’re expecting a much more radical vision for change to be laid out in the upcoming Milburn review, with the Government making warm noises to suggest that they will be willing to accept those recommendations.
What do we think they should do? You can pull together an answer from our previous publications – but our Chief Exec Stephen Evans is going to be publishing his own succinct vision for youth employment in the coming days.
Employment is down in key private sector industries – and vacancies are down almost everywhere
So – where might the jobs for those young people come from? Much has been made of the demise of the ‘Saturday job’, and the gaps that now exist for young people seeking to get their first taste of the world of work. Employee numbers in hospitality and retail have fallen by 117,000 over the last year (more than all other industries combined), and vacancies are down as well.
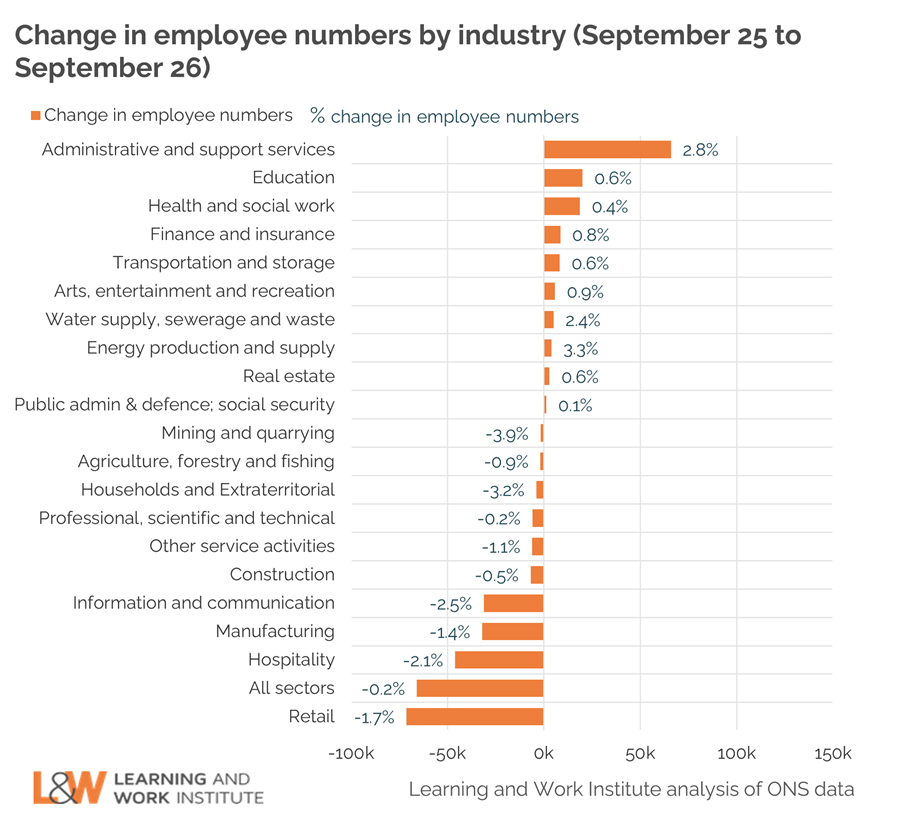
Your author enjoyed a discussion last week hosted by Care Matters, highlighting new research which paints the quality of care jobs in a substantially favourable light over retail and hospitality work. One knowledgeable and perceptive panellist asked ‘why shouldn’t a young person’s first job be in care?’. Clearly, in an era of demographic change, social care is likely to be resilient – and there are parts of the country where these are the key vacancies on offer. But these are often not the places where there are also large numbers of young people – and it is worth noting that health and social work vacancies are down over the last year (although employment is up).
While a first job in Woolworth’s might now be a thing of the past (for a number of reasons), it is unlikely that a single sector is going to pick up the slack. A broad approach is needed, with employers working collectively to think about how they are going to meet their pipeline needs over the next decade. The Government can’t solve that problem for each and every sector themselves – but it can create incentives and support mechanisms to help groups of employers get the talent they need. See our recent ‘employer investment in skills’ research for more on this – and reach out of you’ve got thoughts.