



Every month, Learning and Work Institute produces detailed and timely analysis of the latest labour market statistics from ONS. We examine what the figures tell us both about the health of our labour market, and what they mean for people’s experiences of work, with a particular focus on groups facing labour market disadvantage. Become a supporter to receive our monthly briefing delivered directly to your inbox and navigate our labour market dashboard.
July 2026
Stephen Evans, Chief Executive at Learning and Work Institute, said:
The labour market remains relatively flat, although wider survey evidence suggests stabilisation or modest improvement in future months. The data, though, highlight the twin challenges Andy Burnham faces as he takes office. First, the Government is off track for its 80% employment rate ambition, needing another 2.1 million people in work, with a worrying one million young people not in education, employment or training. Second, real average weekly earnings are more than £260 lower than on pre-financial crisis trends, highlighting the deep and persistent cost of living challenges.
In the July edition of the Labour Market briefing, the employment stats stay relatively steady in a time of political change. Following Andy Burnham’s appointment as Prime Minister this briefing takes stock of the labour market he inherits and looking at the progress the Labour Government has made towards its employment aspirations. The Starmer-led Labour Government committed to a long-term ambition to reach an 80% employment rate.
Just before Labour entered government, the employment rate stood at 74.4% in the March to May 2024 period. That rose modestly to 75.2% in the same period of 2025, before edging back to 75.1% in the latest March to May 2026 figures. In short, while there has been plenty of government activity on employment, the headline employment rate has moved very little. A range of factors help explain this. Some have been within government control, while others, including wider economic and global pressures, have not. Whatever the causes, the challenge remains the same for Burnham: turning policy ambition into measurable labour market outcomes.
One of the big initiatives rolled out over the last year has been Connect to Work, which seeks to help disabled people and those living with long-term health conditions find, keep and sustain work. Despite the investment in the programme, of over £1 billion, performance has not yet met expectations. The business case said DWP were expecting 14,000 people to achieve an employment outcome in the 2025/26 financial year, but DWPs latest figures show only 1,644 received first earnings from employment over this period.
Much like the employment rate, the other key stats covered in today’s release continue to remain stagnant. The headlines numbers have not changed over the last quarter, and little over the last year with employment, unemployment and economic inactivity remaining more or less the same as this time last year.
Beneath the national picture, however, there are important differences across the country. To reflect the increasing policy focus on local growth and devolution, we have broken down employment rates across different areas. While the national picture has barely shifted, this masks significant differences across the country. Employment rates range from over 85% in the strongest-performing city regions to below 70% in others, underlining the extent of the geographical inequalities that continue to shape labour market outcomes. Closing these gaps will be critical if the Government is to make meaningful progress towards its 80% employment ambition.
The wider labour market also remains subdued. Vacancies continue to fall, and average weekly earnings remain below pre-pandemic trends. Meanwhile, employment challenges in hospitality and retail persist, which reduces opportunities for young people entering the labour market who often work part-time in these industries.
It remains to be seen whether the business community will feel more, or less, optimistic with a new PM at the helm. But as the conflict in the Middle East has dragged on, business confidence has dampened further, which may be behind the weaker hiring trends.
Labour supply (employment) remains flat
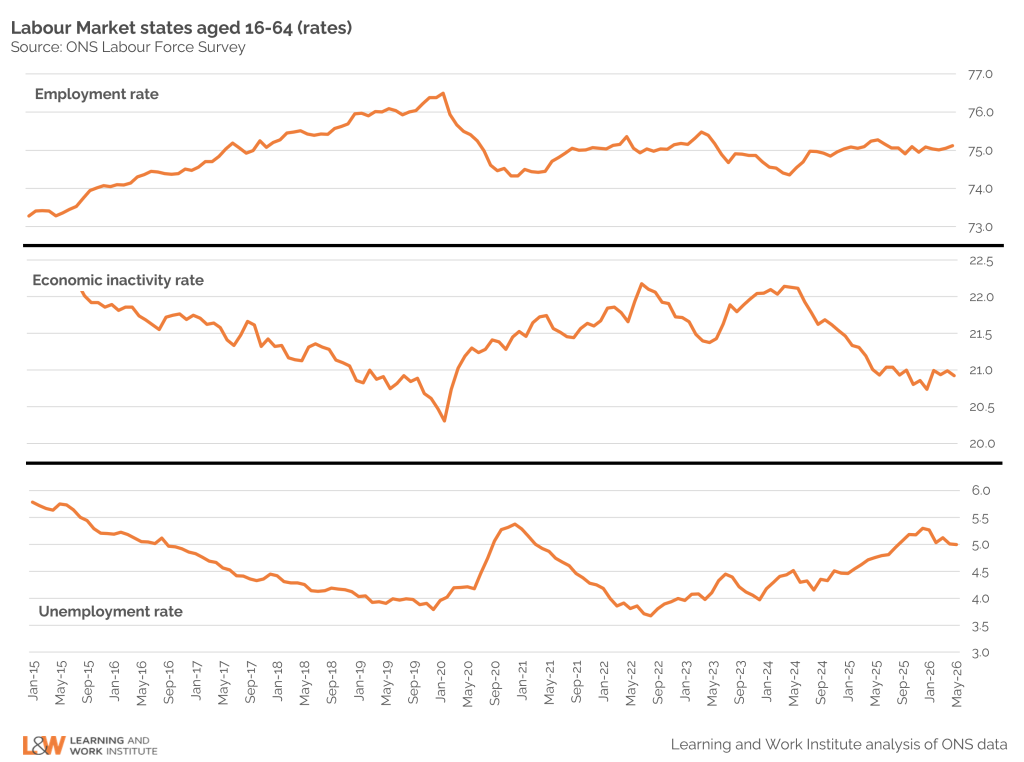
The headline employment stats from the labour force survey have remained essentially flat once again. The employment rate is 75.1% for the March-May quarter, up slightly from 75.0% last quarter, and compared with 75.2% this time last year.
Unemployment similarly remains flat at 5.0% for this quarter. Generally speaking, we have now been consistently circling 5.0% since early 2026. This is a small increase from this time last year (4.8%) – but is still elevated above 2022 levels.
And lastly to round out the headline employment stats trifecta, we’ll focus on economic inactivity. Unsurprisingly this is following similar trends, economic inactivity is at 20.9% for this quarter (compared to 21.0% for last quarter and 21.0% at this time last year). There has been minor improvement from rates pre-election, with economic inactivity at 22.1% in March-May 2024.
Employment by region
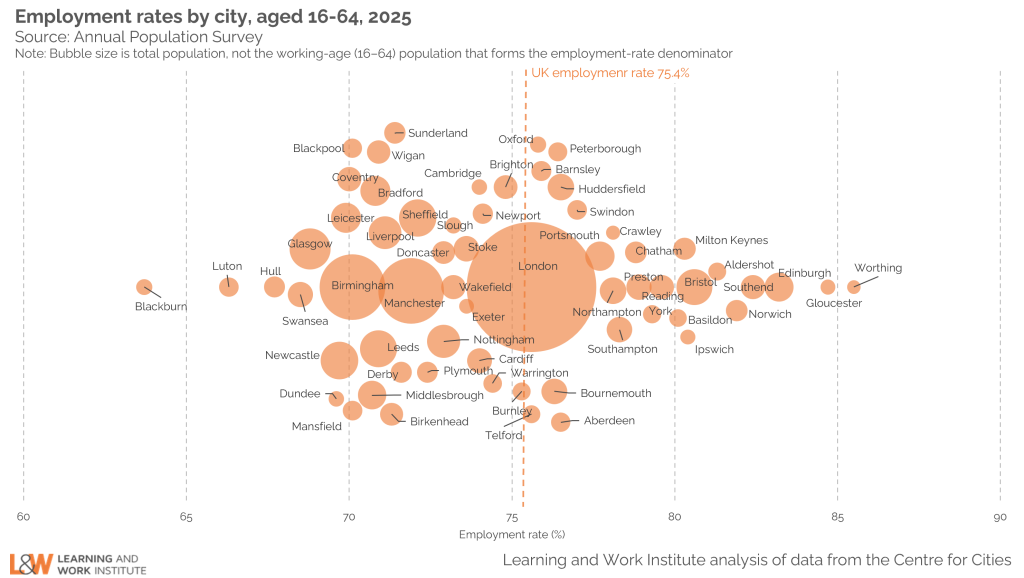
Focussing solely on the national employment rate masks striking differences between places. According to Centre for Cities data while the UK employment rate stood at 75.4% in 2025, city employment rates ranged from 63.7% in Blackburn to 85.5% in Worthing. Many of the strongest-performing cities are concentrated in the South and East of England, while a number of former industrial towns and cities in the North, Midlands and Wales have lower employment rates. These disparities highlight that the challenge facing the Government is not simply raising overall employment, but narrowing longstanding geographical gaps in labour market opportunity.
For Andy Burnham’s Government, this reinforces the importance of pairing effective employment support with regional economic development, to create good work in the right places. Achieving the ambition of an 80% employment rate will require progress in cities and towns that have persistently lower employment levels, particularly where economic inactivity and health-related barriers to work remain high.
Employment outcomes for young people
Our last Labour Market briefing coincided with the publication of the Milburn Review, which highlighted the growing challenges facing young people as they navigate the transition from education into work. We provided a deep dive into how few young people NEET were being reached by Government support, and the increasing numbers of NEETs who have any work experience.
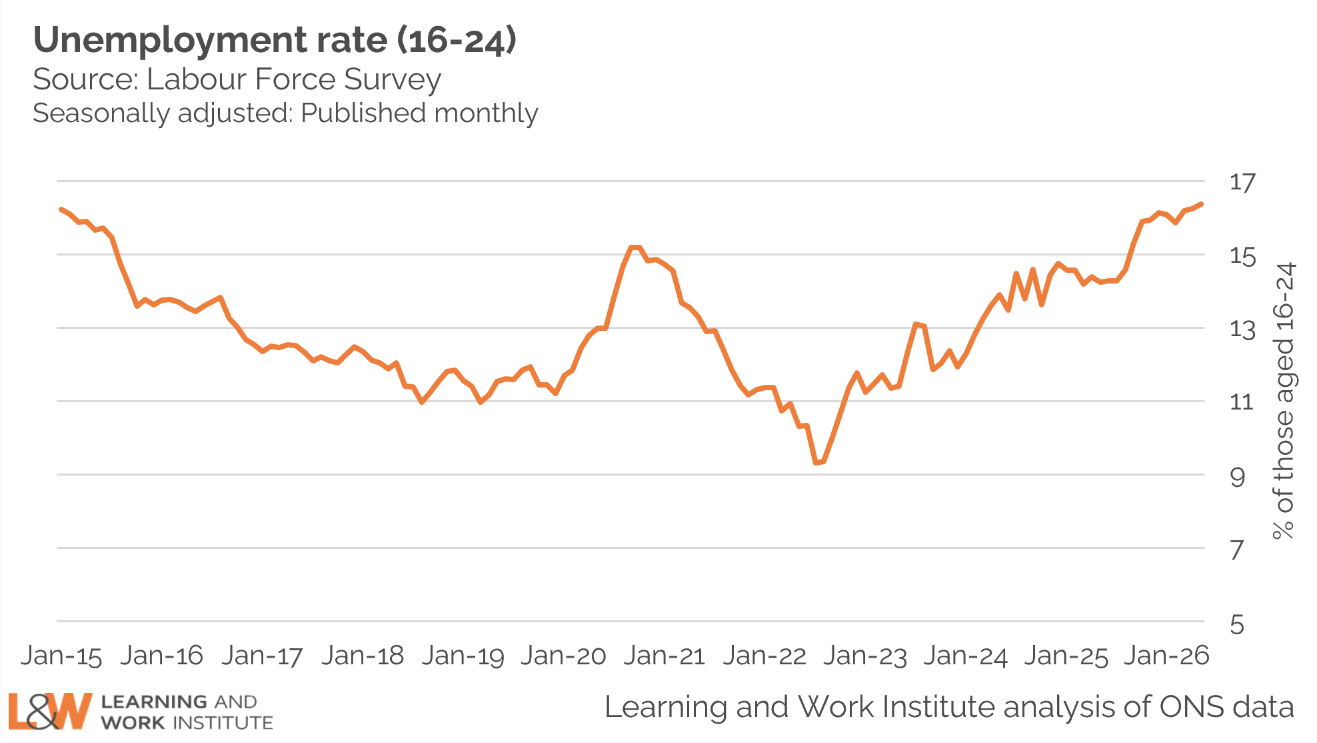
Youth unemployment stands at 743,000, or 16.4%, this quarter, a small increase from 715,000 (15.9%) last quarter and substantially higher than a year ago, when 631,000 young people (14.2%) were unemployed.
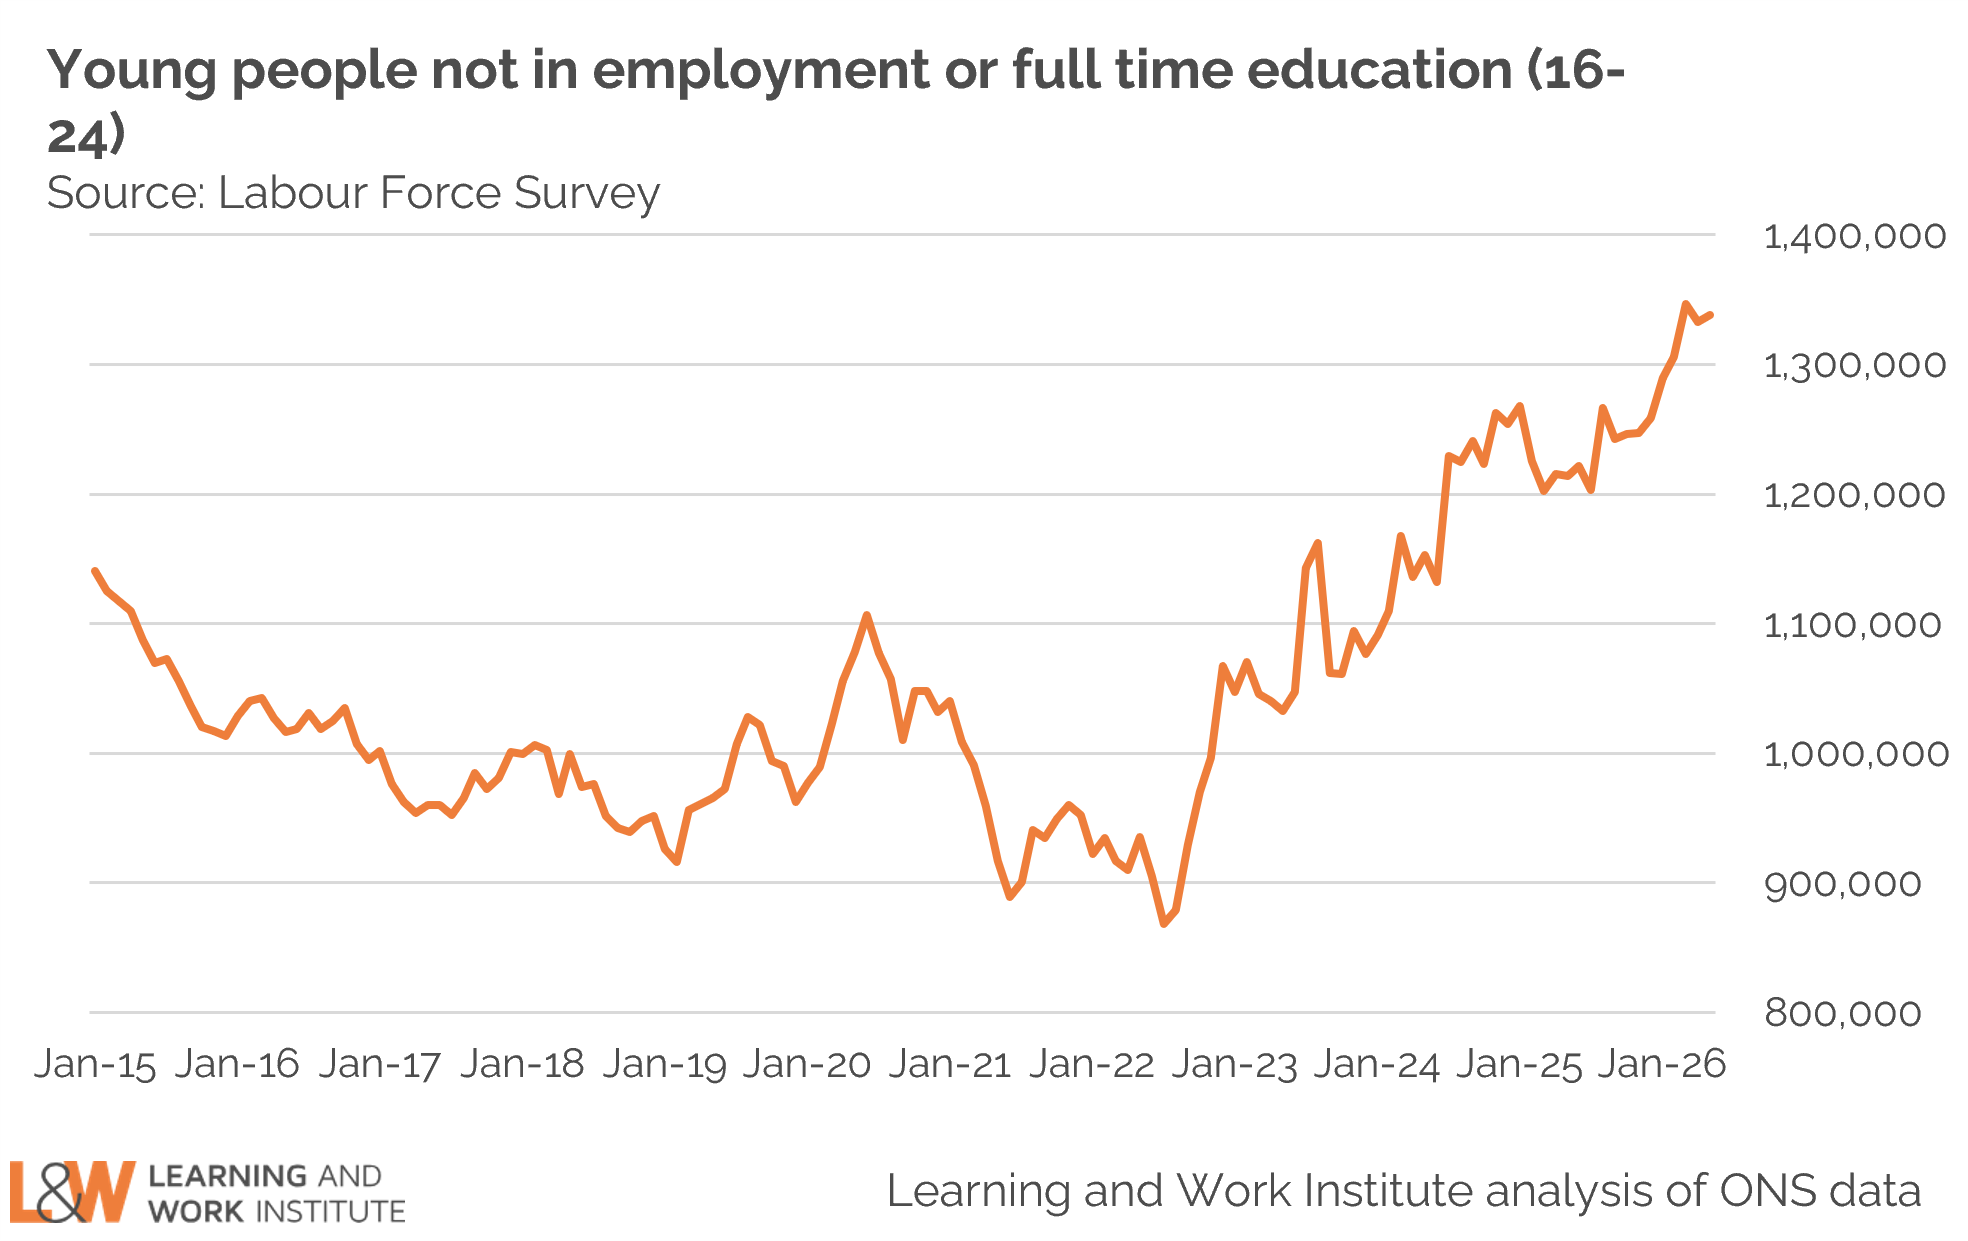
A similar picture emerges when looking at young people who are Not in Education, Employment or Training (NEET). This remains stubbornly high at around 1.3 million, close to its highest level in more than a decade. As the chart above shows, the number has risen sharply since 2022 and shows few signs of returning to pre-pandemic levels.
These figures are particularly concerning given the Government’s focus on youth employment through initiatives such as the Youth Guarantee and the eight Youth Guarantee Trailblazers. These programmes largely have a supply-side focus, intended to improve employability and pathways into work, and the data so far has not shown a significant improvement as a result. With vacancies falling, and employers reporting subdued recruitment activity, too few opportunities are being created for young people entering the labour market. Without stronger labour demand, progress in reducing youth unemployment and inactivity is likely to remain slow.
A tougher job market for those looking for work
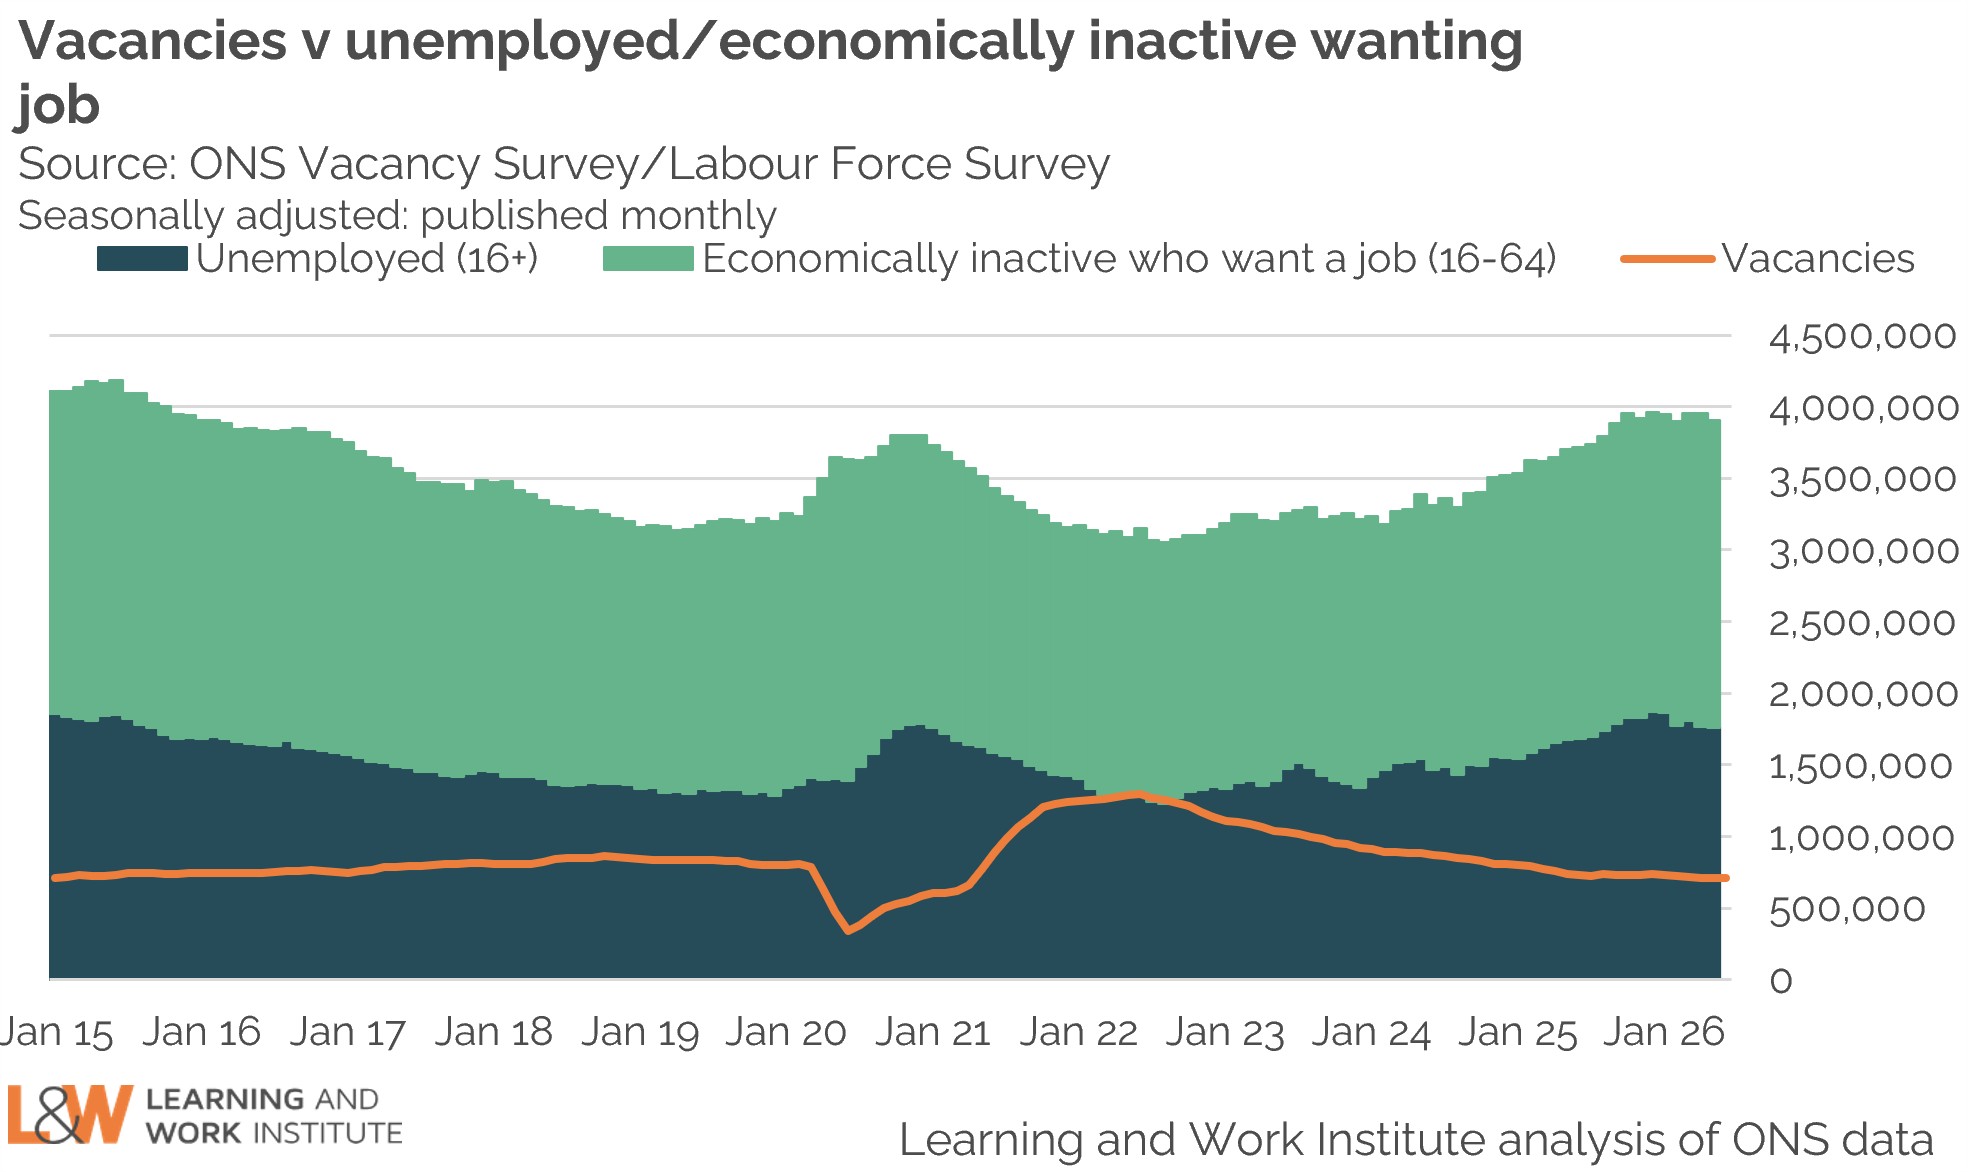
It remains a challenging labour market for those looking for work. Vacancies fell again to 712,000 in the quarter to June 2026, down from 718,000 last quarter and 730,000 a year ago. At the same time, the number of people who are out of work but want a job has continued to rise.
As a result, there are now around 5.4 people seeking work for every vacancy. The contrast with the labour shortages seen in 2021 and 2022 is stark: vacancies have fallen steadily from their peak while the pool of people wanting work has grown. Evidence from the ONS Vacancy Survey suggests that the fall in vacancies may be driven by small businesses, which cited the cost of hiring and overall expenses as the reason for not taking on new staff.
This could help to explain why employment growth has stalled despite significant policy activity. While support programmes can help people move closer to work, stronger progress will also depend on a recovery in labour demand and hiring activity. Without more vacancies being created, competition for jobs is likely to remain intense, particularly for young people and those furthest from the labour market.

A shifting sector picture
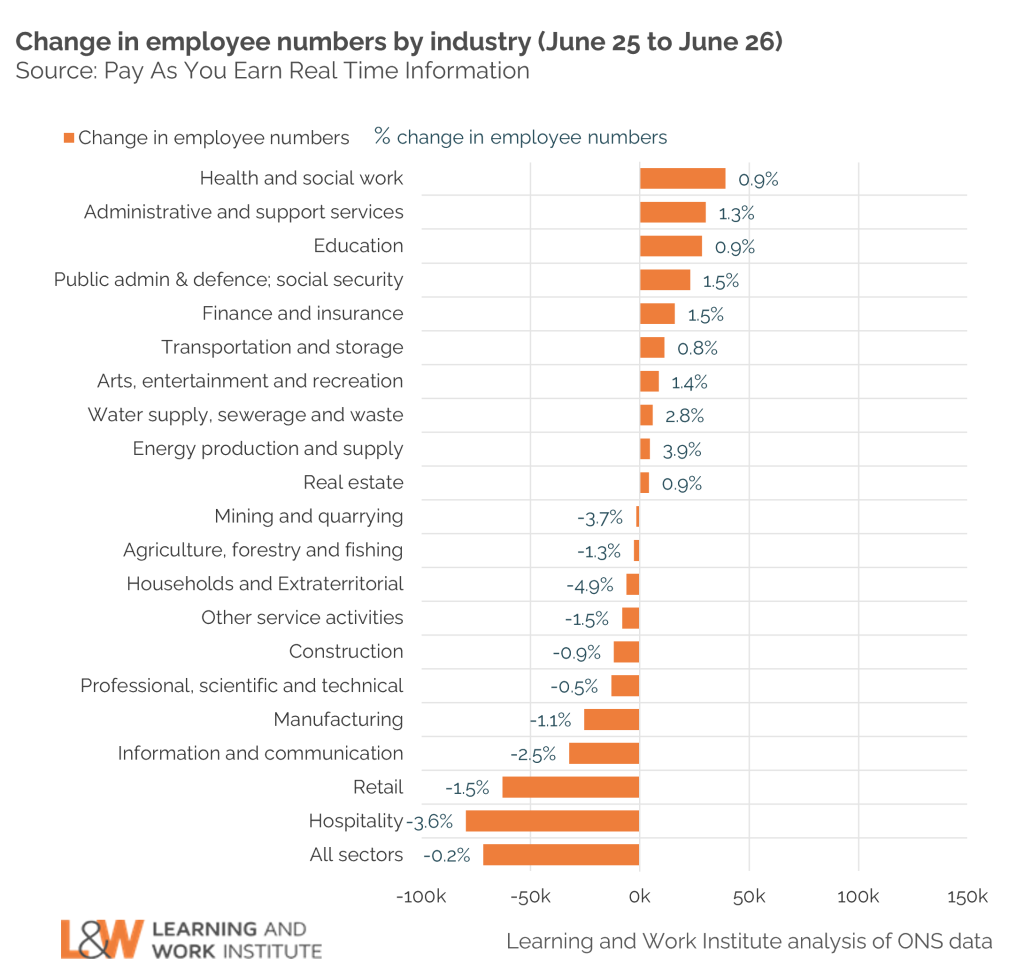
PAYE data suggest the labour market remains broadly flat overall, with employee numbers falling by around 30,000 over the quarter and by more than 70,000 over the year. Wider survey evidence from the KPMG and REC UK report on jobs points to redundancies adding to the increased number of people seeking work. However, redundancies are down from the previous quarter and lower than the same time last year in ONS statistics.
Behind this headline picture, however, there are marked differences between sectors.
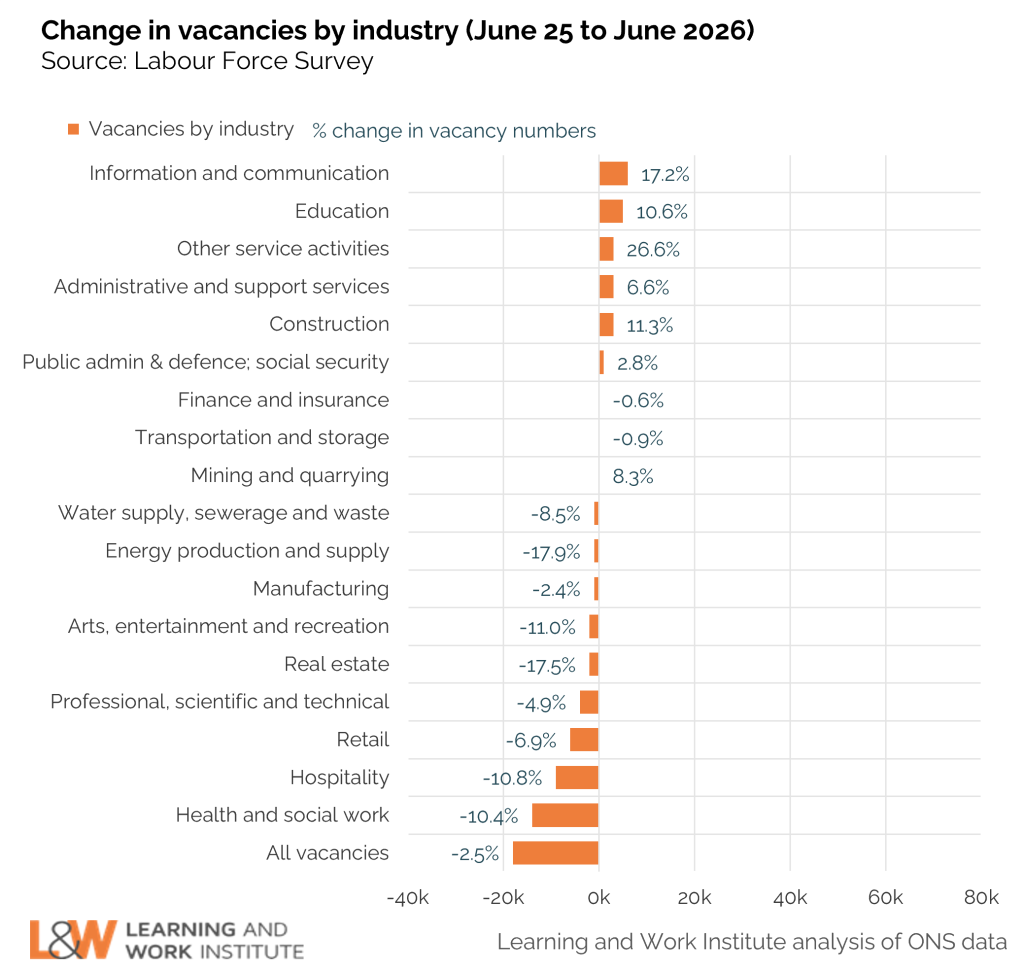
Hospitality and retail continue to face the greatest challenges. Together, they have lost more than 140,000 employees over the last year, with employment falling by 3.6% in hospitality and 1.5% in retail. Vacancies have also declined sharply, down 10.8% and 6.9% respectively. This combination of falling employment and weakening recruitment points to ongoing pressures in consumer-facing sectors. Recent Bank of England analysis has also suggested that workers leaving hospitality jobs are increasingly likely to experience unemployment, indicating that many are finding it difficult to move into other forms of work.
By contrast, growth remains concentrated in public service sectors. Health and social work has added more than 39,000 employees over the past year, maintaining its position as one of the largest contributors to employment growth. However, there are signs that this growth is slowing. While workforce numbers are still rising, vacancies have fallen by 10.4%, the largest reduction of any major sector, suggesting employers are becoming less reliant on recruitment to expand capacity.
Education stands out as one of the few sectors seeing growth in both employment and vacancies, with employee numbers up 0.9% and vacancies rising by 10.6% over the past year.
The Government has also made commitments to enable the delivery of 1.5 million new homes across England in this parliament, which will rely heavily on the construction sector. The industry will need the right workers, at the right time, with the right skills to support this ambition – a tall order for an industry which often suffers through cycles of boom and bust. While construction lost 11,776 employees over the last year with employment falling by 0.9% (only a moderate fall compared with hospitality and retail), vacancies are on the rise with an 11.3% increase compared with this time last year.
Overall, the sectoral picture reinforces the broader story of a labour market with subdued and patchy growth. This raises questions about where future employment growth will come from if the Government is to make meaningful progress towards its employment ambitions.
Real pay growth remains low meaning cost of living challenges remain
The latest inflation figures provided some welcome news, with CPIH inflation remaining at 3.0% in the year to May 2026. While this is below the peaks seen in recent years, it remains above the Bank of England’s 2% target and continues to weigh on household budgets.
Against this backdrop, earnings growth has slowed significantly. Real regular pay grew by just 0.3% over the year to May 2026, meaning that, on average, workers have seen little improvement in their spending power over the last year.
The picture varies across the economy. Nominal public sector pay growth remained relatively strong at 5.5%, reflecting the timing of recent NHS pay settlements. In contrast, private sector pay growth was 2.9%, slightly below inflation. For many workers, pay increases are therefore doing little more than keeping pace with rising prices.
In some lower-paid sectors, stronger wage growth is likely to reflect recent increases in the National Living Wage. While this has boosted earnings for many workers, the rising cost pressures for employers has likely had an impact on dampening employment and vacancies.
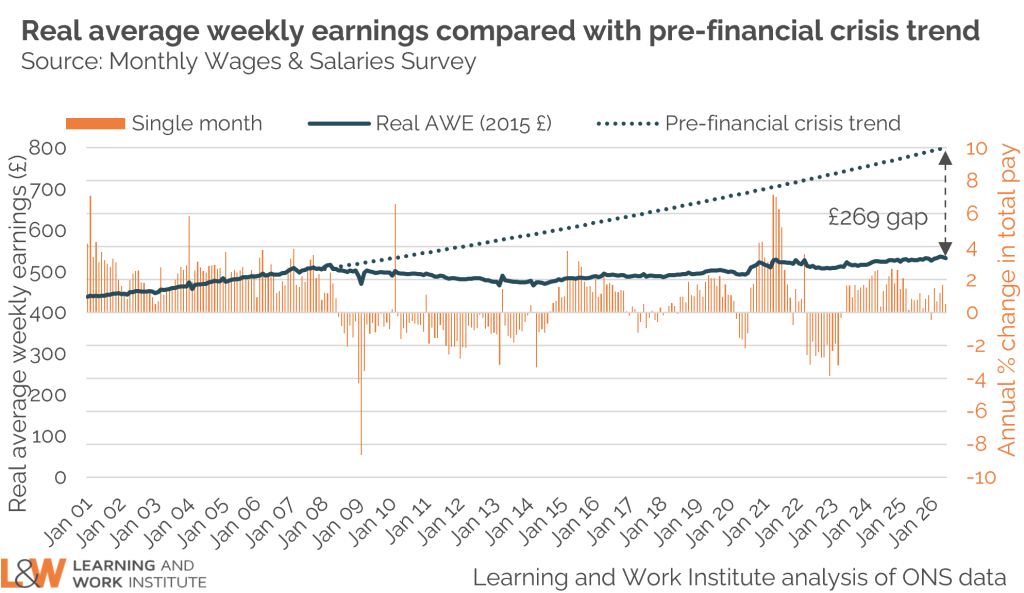
More broadly, the UK’s long-term earnings challenge remains unresolved. Despite recent improvements in real wages, average weekly earnings remain around £269 below where they would have been had the pre-financial crisis trend continued.
The new Prime Minister has announced that tackling the cost of living is a key priority, to “put more money in people’s pockets and bring back hope.” However, making real improvements is not only about getting more people into work, but also about improving productivity, pay and living standards over the long-term.