
This is the second of six reports published to inform the ‘Youth Commission’: the Commission on Education and Employment Opportunities for Young People. The Youth Commission considered the current education and employment prospects for young people, and the likely impact of changes in policy and the labour market. Read our final report, published in December 2020.
The Youth Commission proposed new ideas for ensuring all young people have access to opportunity. It was kindly supported by Association of Colleges, Capital City Colleges Group, London South Bank University, NOCN and Prospects. Its commissioners were: Kate Green MP (until June 2020), Maggie Galliers CBE, Amy King and Jo Maher.
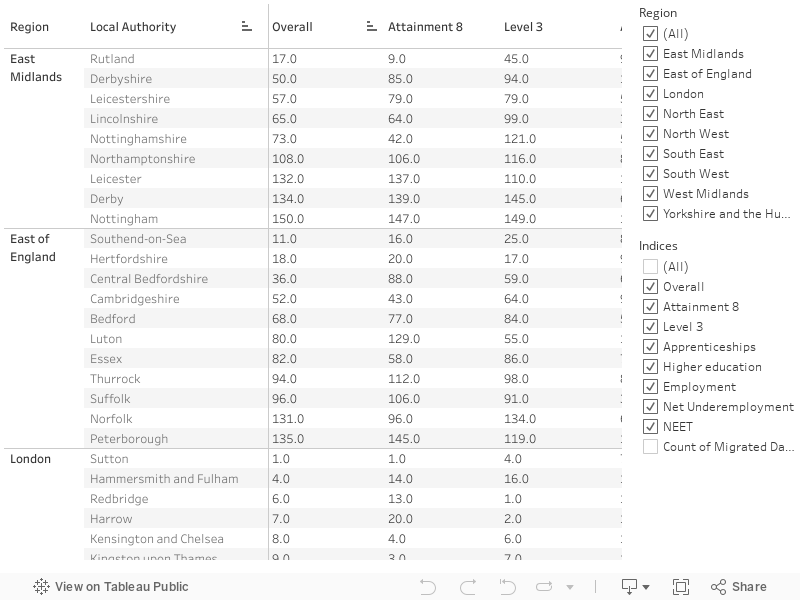
Our Youth Opportunity Index 2018 gives a detailed portrait of the opportunities and challenges for every young person broken down by local education authority. It has revealed the intra-regional differences in England as well as regional ones.
Beneath the headline facts lie six million individual stories about young people. Opportunities and outcomes vary significantly by demographic group and geographical area.
We have analysed data across each of England’s 150 local authorities and those in Wales to quantify and better understand these inequalities. We have shown this through a Youth Opportunity Index for both nations.
This brings together data on achievement at age 16 (Key Stage 4), attainment of Level 3 by age 19, access to higher education, take up of apprenticeships, employment rates, a measure of the quality of work (net underemployment), and the number of 16-17-year olds not in education, employment or training.
It shows a fascinating picture and allows us to dig down below the surface to understand where the opportunity gaps are largest and what is driving them. They are the result of socioeconomic factors, economic circumstance and national policy, as well as local services.
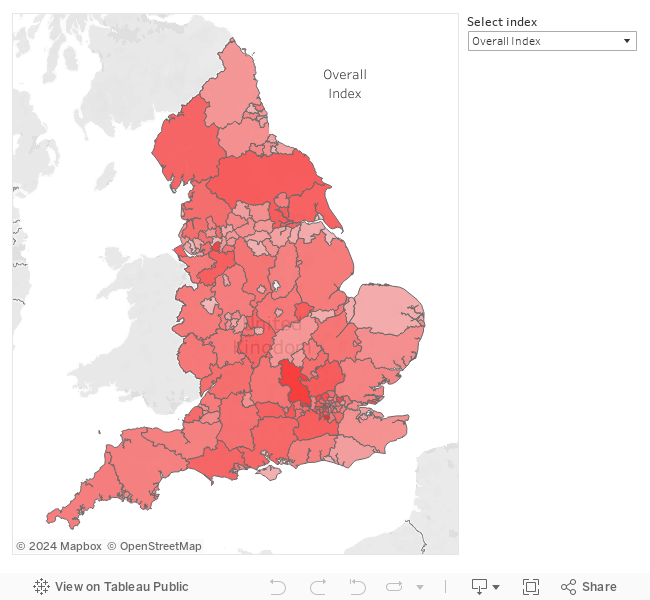
Explore the data for England via an interactive map, by local education authority table, or regional table. The results can be filtered by specific region or specific subject.
About the Youth Opportunity Index
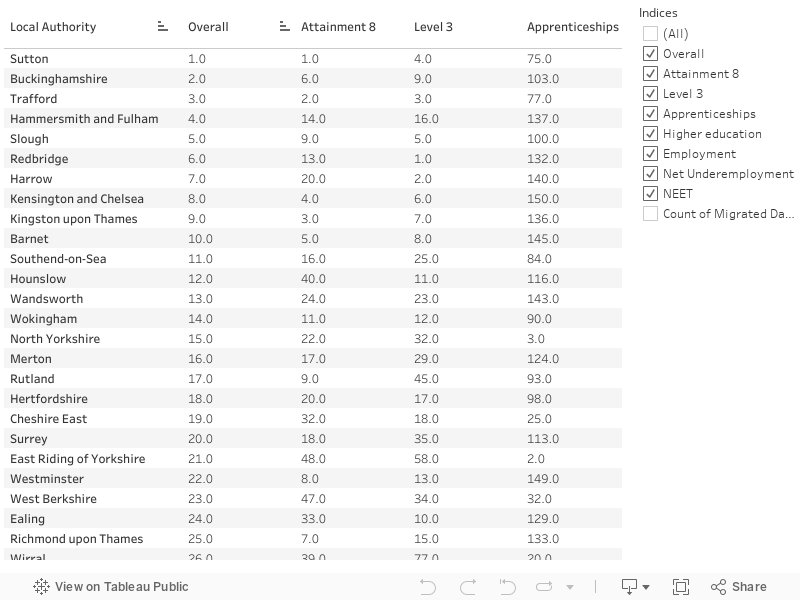
The Index gives a relative measure of education and employment opportunities for young people across England’s 150 local education authorities. The score for each area reflects how its performance compares with the best-performing area in the country; the higher the score, the better the performance. Results are presented as a heatmap, with darker shades representing higher scores.
- Overall Index. The average score across all indices. It gives an overall comparative measure of the education and employment opportunities for young people living in each local area.
- Attainment 8 index. Attainment of GCSE-level qualifications by young people resident in a local area.
- Level 3 index. The proportion of young people resident in a local area qualified to Level 3 by age 19.
- Apprenticeships index. Apprenticeship starts as a proportion of 16-24s in a local area.
- Higher Education index. The proportion of 15 year olds in a local area entering higher education by age 19.
- Employment index. Employment rates for 23-28 year olds.
- Net underemployment index. This measure is the balance between the numbers of young people wanting to work more hours and the numbers wanting to work fewer hours.
- NEET index. The proportion of 16-17 year olds not in education, employment or training.
Interactive maps for the Youth Opportunity Index 2018
Use this interactive map to explore the Youth Opportunity Index.
Interactive tables for the Youth Opportunity Index 2018: local authorities
Use this table to explore the ranked performance of local areas for each index.
Interactive tables for the Youth Opportunity Index 2018: regions
Use this table to explore the regional ranked performance of local areas for each index. Use the toolbar to share, download or reset the table.