November 2025
Dr Helen Gray, chief economist at Learning and Work Institute, said:
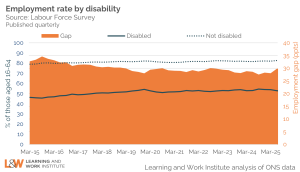
The employment rate for disabled people remains a staggering 30 percentage points below that for people without a disability. Only half of all people of working age with long-term health problems are in employment and this has barely changed since before the Covid pandemic. Yet only one in ten out-of-work disabled people get help to find work each year. Employment support needs to be extended to a much larger proportion of the 741,000 people who are currently economically inactive due to long-term sickness who want to work. Alongside this, both government and employers must ensure that good quality employment opportunities are open to everyone, regardless of their personal circumstances.
1. Headline indicators
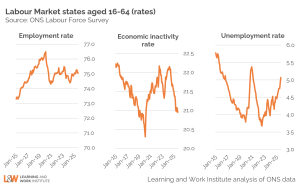
Employment in September 2025 went up by 8,000 on the previous month but fell by 41,000 on the April-June 2025 quarter, to 32,524,000. The employment rate for those aged 16-64 went down to 75.0% compared with 75.3% in the previous quarter.
Economic inactivity for those aged 16-64 went up by 7,000 on the previous quarter to 9.08 million. The economic inactivity rate stayed the same at 21.0%.
Unemployment (for those aged 16-64) went up by 110,000 compared with the previous quarter to 1.74 million. The unemployment rate rose to 5.1% from 4.8% in the previous quarter.
To explore how key labour market indicators have changed over the past 10 years, see our interactive labour market dashboard.
2. Divergence between the Labour Force Survey and other sources in recent years
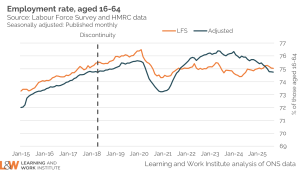
Our headline indicators are based on data from the Labour Force Survey, but since the pandemic this has experienced a decline in the response rate which affects the reliability of estimates from this source. This is illustrated by the divergence in the employment rate estimated from the LFS and other sources over this period. While the ONS seeks to resolve these issues, we are publishing an experimental estimate of the employment rate based on an approach developed by the Resolution Foundation and using administrative data sources, such as HM Revenue and Customs payroll and self-assessment data on the numbers of people self-employed. This measure indicates that in the July to September 2025 quarter, the employment rate for those aged 16 to 64 stood at 74.8%. This was 0.3 percentage points lower than the LFS estimate. We aim to refine this approach in the months ahead.
3. Nominal pay rises continue to outstrip inflation
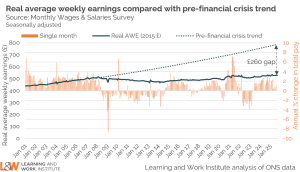
The latest data show average regular earnings grew by 4.6% in the year to September 2025, slightly lower than the 4.7% rise seen in the year to August 2025 and down from the post-pandemic peak of 7.9% in August 2023. For public sector workers average regular earnings grew by 6.6% in the year to September 2025, while average regular earnings grew by 4.2% for private sector workers. After taking account of inflation, real regular earnings went up by 0.5% (3-month average change) in the year to September 2025, with the single month data for September showing a real-terms increase of 0.4% over the year.
The rate of inflation was unchanged between August and September 2025, when it remained at 4.1%. In the year to September 2025 core CPIH (excluding energy, food, alcohol and tobacco) rose by 3.9%, down very slightly on the 4.0% increase seen in the year to August 2025. There was a small increase in the annual rate of inflation for goods between August and September 2025 (from 2.8% to 2.9%), while the inflation rate for services was unchanged at 4.9% in both months.
Inflation in areas like Housing and household services and Education is still high. In September the UK had the highest rate of inflation in the G7, followed by the United States, where the inflation rate was 3.0%. This compared with an inflation rate of 2.9% in Japan and 2.2% in the Eurozone. Weak growth since the global financial crisis means average earnings are more than £12,000 per year lower than if pre-crisis trends had continued.
4. There are fewer potential workers for employers to recruit, with nearly 1 million fewer over 50s in the labour market since the pandemic started
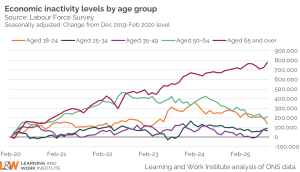
Recruitment has been more challenging for employers since the pandemic because of rises in economic inactivity – people leaving the labour market. Although the number of people aged 50 to 64 who are economically inactive now appears to be on a downward trend, the numbers economically inactive remain 6.6% higher than in the period immediately before the pandemic started.
Economic inactivity has remained unchanged in the most recent quarter, with the rate standing at 21.0% for those aged 16 to 64 in July to September 2025. Overall, the number of those aged 16 to 64 who are economic inactive is 634,000 higher than pre-pandemic, yet only one-in-ten out-of-work older people and people with a disability get support to find employment each year. The Government needs to extend employment support to more people outside the labour market and employers need to think about recruitment and job design to attract and retain staff.
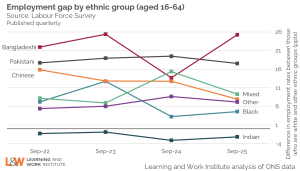
5. Quarterly data on employment rates by ethnic group and by disability show substantial differences remain between groups
The difference between the employment rates of people who are from a Chinese ethnic background, compared with people who are white, appears to have narrowed over the past four years. For those from a Pakistani, Indian or other ethnic background, the size of the gap in the employment rate compared with white people has remained largely unchanged over this period. For all other ethnic groups, the gap in the employment rate compared with white people has shown considerable variation over the past four years, making it difficult to conclude that it has either narrowed or widened.
As the figures on employment rates for different ethnic groups are not seasonally adjusted, patterns vary from quarter to quarter and the reweighting of the Labour Force Survey from the January to March quarter of 2019 onwards creates a discontinuity which makes it difficult to compare employment rates over a longer period. Differences in response rates and sample sizes between ethnic groups also result in volatility over time, making it difficult to identify clear patterns. It is therefore generally unclear whether the gap in employment rates compared with people who are white has risen or fallen over the past four years for each of the ethnic groups considered. Most ethnic groups remain substantially less likely to be in employment than people who are white, with the exception of those from an Indian background.
The employment rate for people with a disability has generally been on an upward trajectory over the past 10 years. In the July to September quarter of 2025, 52.3% of people with a disability were employed – a smaller proportion than in the same quarter one year earlier, when the employment rate for people with a disability stood at 54.5%. The difference in the employment rates of people with a disability and those without a disability has generally narrowed over time but remains substantial and the gap rose in the most recent quarter compared with the same quarter one year earlier. In July to September 2025 the employment rate for people with a disability was 30.1 percentage points lower than the employment rate for those without a disability (82.5%). This compares with a gap of 27.5 percentage points in the same quarter of 2024.
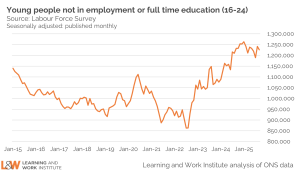
6. The proportion of 16-to-24-year-olds not in employment or full-time education is largely unchanged compared with a year ago and remains above pre-pandemic levels
The unemployment rate for young people aged between 16 and 24 in the July to September 2025 quarter was 15.3%, 0.5 percentage points higher than the rate in the same quarter one year earlier (14.8%). The number of young people aged between 16 and 24 who are not in employment or full-time education currently stands at 1,226,000. Our new report on young people and the benefits system highlights the fact that around half of all young people who are not in education, employment or training are not claiming benefits, making it difficult to reach them and offer appropriate support.
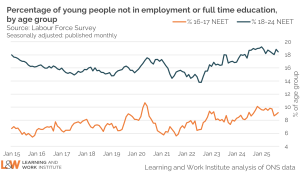
The percentage of those aged 16 to 17 who were not in employment or full-time education was almost unchanged in July to September 2025 compared with the same quarter one year earlier (9.2% and 9.0% respectively). Over the same period the percentage of 18-to-24-year-olds who were not in employment or full-time education fell slightly from 19.0% to 18.5%. Our Youth Opportunity Index gives a detailed portrait of the opportunities and challenges for every young person broken down by local education authority.
7. Signs of caution by employers, while 2.1 million people who are economically inactive want a job
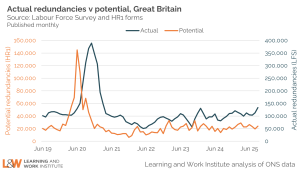
Employers are required to give the Insolvency Service advanced notice of any plans to make 20 or more employees at a single establishment redundant by completing an HR1 form. This gives an estimate of potential redundancies before plans are finalised. The minimum notice period required ranges from 30 to 45 days, depending on the number of employees at risk of redundancy. While there is no advanced notice of most redundancies, information from the HR1 form does provides an early indicator of a possible change in the labour market. For example, a spike in potential redundancies in June 2020 was followed by a peak in the number of people made redundant in the September to November quarter of 2020.
In the July to September quarter of 2025 potential redundancies stood at an average of 22,147 a month, down on the monthly average of 23,971 over the previous quarter. However, potential redundancies are considerably higher than during the same quarter in 2024 when they averaged 18,044 a month. This suggests that actual redundancies are likely to remain elevated for some time to come. Actual redundancies in July to September 2025 were up by 29,000 on the previous quarter, and up by 43,000 on the same quarter a year earlier.
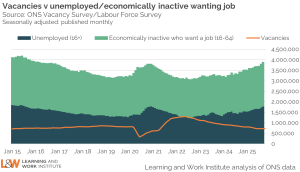
Headline vacancies in the August to October 2025 quarter were almost unchanged on the previous quarter (up by 1,000). The headline ONS vacancy figure is both seasonally adjusted and a three-month average. Even with signs that the number of potential redundancies notified is starting to fall, the general downward trend in vacancies suggests that employers are currently cautious about the state of the economy.
Using the official measure of unemployment, there are 2.5 unemployed people for every vacancy. However, there are an additional 2.1 million people who are economically inactive but want a job. People in this group will need to be supported to find work if the government is to achieve its ambition of an 80 per cent employment rate.
8. Numbers out-of-work and claiming unemployment-related benefits below the ILO measure of unemployment
From those aged 16 or more, unemployment in the July to September 2025 quarter was 1,789,000. The quarterly headline figure has risen by 117,000 since the April to June 2025 quarter.
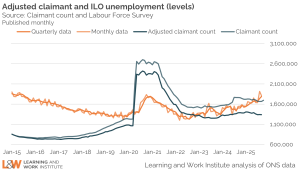
Under Universal Credit, people who are in employment, but on very low earnings are required to search for work. The administrative earnings threshold, below which claimants are required to engage in work search, has increased over time, bringing more employed people into the claimant count. At present, those making an individual claim for Universal Credit are required to look for better-paid work if they earn less than £952 during the month-long assessment period. Those claiming Universal Credit as part of a couple are obliged to look for better-paid work if their combined earnings are less than £1,534 in the assessment period.
Adjusting the claimant count to exclude those who are employed at some point during the month-long assessment period may understate the number of people who are unemployed and claiming out-of-work benefits on a particular day within that period. However, excluding employed claimants means the adjusted claimant count is more comparable with the official quarterly estimate of unemployment.
After excluding 328,619 individuals who were in very low-paid work at some point during the assessment period, 1,338,091 people were unemployed and claiming out-of-work benefits in September 2025. The number of people who were claiming unemployment-related benefits while out-of-work was 451,000 lower than the number unemployed on the official quarterly measure.
9. Unemployment rates rising for younger people but fairly stable for older age groups in recent quarters
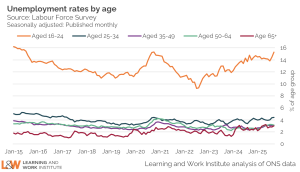
The 16-to-24-year-old unemployment rate (including students) was 15.3% of the economically active in the July to September quarter of 2025. The rate for those aged 25 to 49 was 3.7%. For those aged 50 and over it was 3.1%. Compared with the previous quarter the unemployment rate has risen for 16-to-24-year-olds, but is almost unchanged for those aged 25 to 29 and those aged 50 or more. For 16-to-24-year-olds the unemployment rate was up by 1.1 percentage points in the most recent quarter compared with the April to June quarter of 2025, whereas for those aged 25 to 49 it was up slightly (by 0.2 percentage point) and for those aged 50 or more it was almost unchanged (an increase of 0.1 percentage points). Compared with one year earlier, the unemployment rate for 16-to-24-year-olds was 0.5 percentage points higher in the July to September quarter of 2025, while it was 0.7 percentage points higher for those aged 25 to 49 and 0.5 percentage points higher for those aged 50 or more.
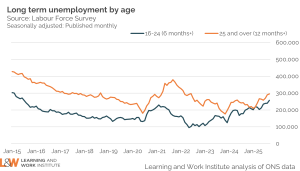
10. Both youth and adult long-term unemployment rising
Youth long-term unemployment (which can include students) has risen by 23,000 over the last quarter and stood at 258,000 in July to September 2025. It has risen by 59,000 over the past year. Long-term unemployment for young people is normally counted as being unemployed for six months or more.
Adult long-term unemployment on the survey measure was 295,000 in the July to September quarter of 2025. The number of people aged 25 and over out of work for 12 months or more has risen by 37,000 in the most recent quarter compared with the previous quarter (April to June 2025). Compared with the same quarter one year earlier, adult long-term unemployment has risen by 65,000.
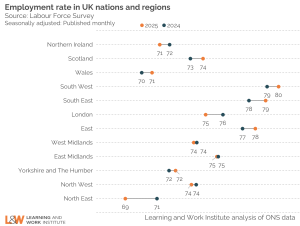
11. The employment picture varies across the country
The smaller sample sizes underlying regional estimates of employment and economic inactivity mean that caution is needed in interpreting changes over time. However, employment rates in the July to September 2025 quarter were higher than the equivalent quarter one year earlier in Scotland, Wales, the South West, South East and East of England and Yorkshire and the Humber. The South East saw the largest increase in the employment rate, at 1.2 percentage points. By contrast, employment rates in July to September 2025 were lower than they had been one year earlier in Northern Ireland, London and the North East of England. The fall in the employment rate over this period was greatest in the North East, where it declined by 2.2 percentage points. In the West Midlands, East Midlands and North West there was little change in the employment rate compared with one year earlier.
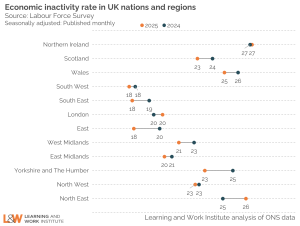
The rate of economic inactivity in the July to September 2025 quarter was lower than it was one year earlier in Scotland, Wales, the South East, the East of England, the West Midlands, the East Midlands and Yorkshire and the Humber. The reduction in economic inactivity was greatest in Yorkshire and the Humber, where it fell by 2.1 percentage points over this period. In London and the North East, the rate of economic inactivity rose compared with one year earlier. The increase in the rate of economic inactivity was most pronounced in the North East, which saw a rise of 1.7 percentage points. In Northern Ireland, the South West and the North West the rate of economic inactivity was almost unchanged on the same quarter one year earlier. This varying picture, which is even greater at sub-regional level, shows the importance of tackling inequalities so everyone has a fair chance in life wherever they live.
Navigate our labour market dashboard
Explore our latest interactive charts and analysis