December 2023
For the third month running, uncertainties created by falling response rates to the Labour Force Survey mean the Office for National Statistics has released a more limited set of data, adjusted in line with trends in administrative data sources, such as HMRC PAYE data and the claimant count of unemployed people. However, these administrative data have their own challenges. Significant caution should therefore be exercised in the use of these statistics until a new Labour Force Survey and revised population projections are available in 2024.
Helen Gray, chief economist at Learning and Work Institute, said:
As ONS has only published a partial set of labour market statistics for the past few months, our ability to explore the nuances underlying today’s headline figures is again limited. There has been little change in the key indicators in recent months, with the rates of unemployment, employment and economic inactivity all the same in the August to October quarter of 2023 as in the May to July quarter. However, ONS have not published information on the reasons for economic inactivity, the educational status of young people and the duration of unemployment spells since their September 2023 release. This means that turbulence may be passing unnoticed below the apparent stability in the labour market.
Catch up on our online Employment and Skills Summit
On Thursday 23 November, we took a deep dive into the question of 'where next for employment support?'.

1. Headline indicators
Employment in October is up by 25,600 on the previous month and up by 50,300 on the May-July 2023 quarter, to 33.0 million. The employment rate for those aged 16-64 remained the same at 75.7%, compared with the last quarter.
Economic inactivity for those aged 16-64 is slightly down, by 2,500, on the previous quarter, to 8.7 million. The economic inactivity rate remained the same at 20.9%.
Unemployment for those aged 16-64 rose by 12,800 compared with the previous quarter to 1.4 million. The unemployment rate remained at 4.3%. As with the employment and inactivity rate, this was unchanged compared with the May-July quarter of 2023.

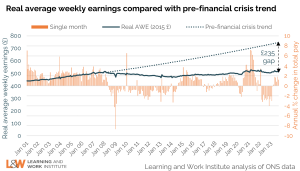
2. Real wages rose slightly as inflation slows, but remain well below pre-financial crisis trends
The latest data show average regular earnings grew by 7.3% in the year to October 2023. For public sector workers average regular earnings grew by 6.9%, while average regular earnings grew by 7.3% for private sector workers. The slowing rate of inflation means real regular earnings went up by 1.4% (3-month average change) in the year to October 2023, with the single month data for October showing a real terms increase of 1.5% over the year.
Inflation remained stubbornly high over the Summer, but decreased sharply between September and October, when CPIH fell from 6.3% to 4.7%. The reduction in core CPIH (excluding energy, food, alcohol and tobacco) between September and October was less dramatic. In the year to October 2023 core CPIH rose by 5.6%, down from 5.9% in September. Also, inflation in areas like Food and non-alcoholic beverages, Health, Communications and Restaurants and hotels is still very high. Inflation in the UK remains above that in other countries in the G7. The United States is currently experiencing an inflation rate of 3.2% while the Eurozone average is 2.4%. Weak growth since the global financial crisis means average earnings are around £12,000 per year lower than if pre-crisis trends had continued.
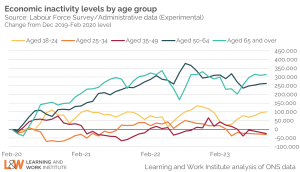
3. There are fewer potential workers for employers to recruit, with 613,000 fewer over 50s in the labour market since the pandemic started
Recruitment has been more challenging for employers since the pandemic because of rises in economic inactivity – people leaving the labour market. The number of people aged 50 to 64 who are economically inactive has increased by 8.5% since the pandemic started.
Economic inactivity has been stable in the most recent quarter, with no change in the rate in July to September 2023 compared with April to June 2023. But the challenge remains: the number of those aged 16 to 64 who are economic inactive is 357,000 higher than pre-pandemic, yet only one in ten out-of-work older people and disabled people get employment support each year. The Government needs to extend employment support to more people outside the labour market and employers need to think about recruitment and job design to attract and retain staff.
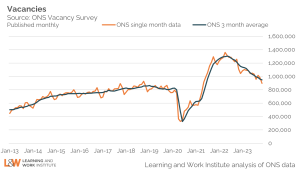
4. Vacancies are falling, but remain high by historic standards
Headline vacancies this month stand at 949,000, down by 45,000 compared with the previous quarter. The ONS’ experimental single-month vacancy figure has fallen by 86,000 over the past month. The headline ONS vacancy figure is both seasonally adjusted and a three-month average.
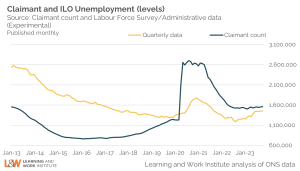
5. Numbers claiming unemployment-related benefits continue to exceed ILO measure of unemployment
Recent adjustments to the Labour Force Survey to align with other sources have closed the sizeable gap between the numbers claiming unemployment-related benefits and those unemployed on the official measure. For those aged 16 or more, unemployment is 1,453,000, up by 5,000 from last month’s published level, and the quarterly headline figure has risen by 13,000. The ONS figure for claimant unemployed was 1,575,000 in November, up by 16,000 on the previous month and 34,000 on the quarter. In October 2023 the number of unemployed people who were claiming unemployment-related benefits was 106,000 higher than the number unemployed on the official measure.
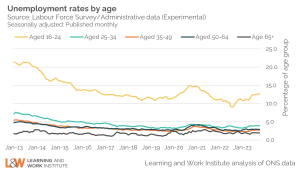
6. Unemployment rate much higher for young people than for those aged 25+
Of those who are economically active, the unemployment rate is 12.7% among 16- to 24-year-olds. The rate for those aged 25 to 34 is 3.9%, whilst it is 2.7% for those aged 35 to 49. For those aged 50 to 64 the unemployment rate is 2.9% and for those over 65 years of age it is 1.9%. In the most recent quarter (August to October 2023), the unemployment rate rose by 0.3 percentage points for 16- to 24-year-olds compared with May to July 2023, but remained unchanged for all other age groups.