January 2020
The latest labour market figures published on 21 January are remarkably positive with an unexpectedly large rise in employment in the month and the quarter.
- Unemployment is 1,306,000, risen by 26,000 from last month’s published figure (quarterly headline down by 7,000) and the unemployment rate was stable at 3.8%, on last month and fell by 0.1 percentage points on last quarter.
- The ONS figure for claimant unemployed is 1,241,200, up by 14,900 on last month, and the claimant rate is 3.5%.
- The number of workless young people (not in employment, full-time education or training) is 981,000, has fallen by 26,000 on the quarter, and is now 14.2% of the youth population (down by 0.4 percentage points).
- Youth unemployment (including students) is 482,000, and is down by 12,000 on the quarter.
- There are 1.6 unemployed people per vacancy.
- The employment rate is 76.3% (up by 0.1 percentage points on last month’s published figure and increased by 0.4 percentage points in the preferred quarterly measure).
Duncan Melville, chief economist at Learning and Work Institute, commented:
The monthly and quarterly numbers for employment for August to November 2019 released today are remarkably positive, up by 100,000 and 208,000 respectively, given the current weakness of economic growth and high levels of economic uncertainty associated with Brexit and the nature of our future trading relationship with the EU. Although we anticipated a substantial increase in employment this month, due to the large monthly fall in employment announced in October falling out of the quarterly change, this increase in employment is much larger than we had expected. Welcome to the roaring twenties?
Paul Bivand, associate director for statistics and analysis at Learning and Work Institute's said:
In early 2020, we are planning to revise these briefings. The move to Universal Credit has meant that the level and depth of information on benefit claimants has reduced dramatically, and has meant that some of our regular analysis has become more difficult to interpret. Comments and suggestions for coverage are welcome - contact me here. Benefits statistics in particular are quarterly in large part (some less frequent), so these sections are likely to move to quarterly analysis.
Chart 12: Employment rate in the UK
The employment rate has risen by 0.5 percentage points over the quarter, to 76.3%.
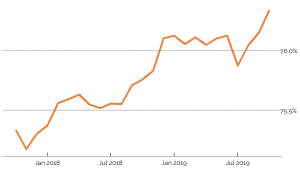
Chart 9: Vacancies – whole economy survey
Vacancies (in the Office for National Statistics survey of the whole economy) rose this month, to 805,000. As the number of vacancies is quite volatile, and frequently revised, the Office for National Statistics uses a three-month average.
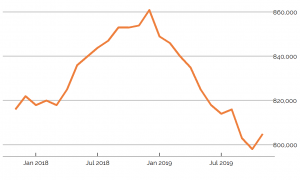
Chart 1: UK unemployment (ILO)
The latest unemployment figure is 1,306,000. It has increased by 26,000 from the figure published last month. The unemployment rate stayed at 3.8%.
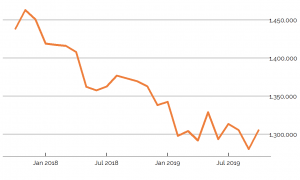
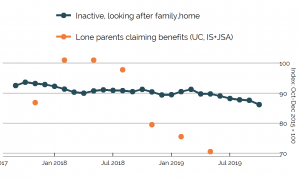
Chart 14: Claimants for inactive benefits and the economically inactive – lone parents
The survey figures (showing those looking after family) continued to fall while benefit measures had fallen earlier.
The benefit figures include lone parents remaining on Income Support as lone parents and Universal Credit claimants in the planning for work group. The latest DWP data does not show any still on Jobseeker’s Allowance.
This chart shows claimants of out of work benefits as lone parents (the orange dots) and survey figures for all those who are economically inactive looking after family (including couple families).