July 2020
This briefing sets out analysis of ONS labour market statistics released on morning of 16 July 2020. The data cover the number of people claiming benefits up to June 2020, and employment and unemployment figures for the period March to May 2020.
Stephen Evans, chief executive of Learning and Work Institute
We are in the midst of a labour market crisis, yet today's headline employment and unemployment figures are barely changed. This is due both to measurement problems and to the Coronavirus Job Retention Scheme - under which 9 million workers have been furloughed - which has kept people employed for now.
"Dig below the surface, and you see signs of the unemployment crisis ahead. The number of hours worked have plummeted 17% since the start of the crisis, to the lowest level since 1997. Payroll employment is down 650,000. The claimant count is over double the level seen in March, and the biggest rises have been in areas where unemployment was highest to start with.
"The real question is what happens when the furlough scheme ends. This week the OBR projected that 15% of furloughed workers - 1.4 million people - will not be able to return to their previous jobs. The Government must look at a flexible extension to the scheme, and put in place urgent support for those at risk of losing their jobs.”
Hours worked have plummeted while headline employment remains broadly unchanged.
The latest data shows the number of hours worked – the best measure of activity in the labour market – have plummeted, yet headline employment has only declined slightly.
The total weekly hours worked across the economy between March and May was down 16.8% compared to the previous quarter. This means there were 175,000 fewer hours worked each week. The number of hours worked has fallen to the lowest levels since 1997. However, the decline in the headline employment rate has been modest in comparison. Over the same period, employment fell by just 126,000, with the employment rate dropping by just 0.2 percentage points.
Figure 1: The fall in hours worked has far exceeded the fall in employment
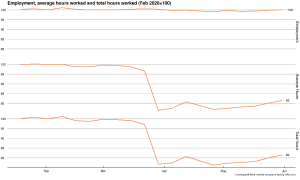
The main reason for this difference is the Coronavirus Job Retention Scheme, under which 9 million workers have been furloughed. These workers remain technically employed, yet work no hours. The unprecedented drop in hours worked suggests the fall in employment would have been far larger without the Coronavirus Job Retention Scheme.
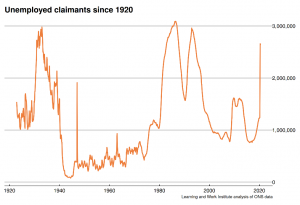
Claimant unemployment is 2.6 million – almost at the levels of the 1980s – and it could rise further
Despite dipping slightly in June, the claimant count remains at historically high levels.
The claimant count is a measure of the number of people claiming benefits principally for the reason of being unemployed, though includes some people with low earnings. After more than doubling between March and May, the claimant count was down by 28,100.
The claimant count in June stood at 2.6 million. This is 122% higher than the figure in March, and the highest levels seen since the mid-1990s.
The claimant count is likely to increase further. Several large employers have announced plans for substantial redundancies in recent weeks, which will not be captured by this data. The withdrawal of the Coronavirus Job Retention Scheme at the end of October risks triggering a ‘second wave’ of unemployment. The OBR’s central projection assumes 15% of furloughed workers – 1.4 million in total – will lose their jobs.
Figure 2: Claimant unemployment has increased to levels last seen in the mid 1990s
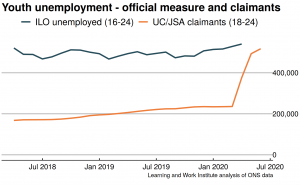
The youth claimant count has exceeded the peak of the last recession
After more than doubling between March and May, the youth claimant count has increased again, reaching 516,800 in June. This exceeds the peak reached following the Great Recession of 508,000 in February 2012.
Concern over a rise in youth unemployment – and the long-term scarring impact that it can cause – led the government to announce a series of measures focused on young people in the Chancellor’s financial statement last week. The £2billion Kickstart Scheme, which will create short term job opportunities for young people, will be introduced from September.
Figure 3: Youth claimant and official unemployment
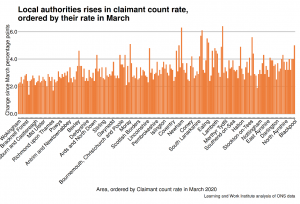
More jobs have been lost in areas with higher pre-crisis unemployment
As Figure 2 below shows, areas with higher levels of claimant count unemployment going into the crisis have seen more jobs lost as a result of the crisis.
The increase in the claimant count has been largest in London (4.5 percentage points), the North East and the North West (both 4.0 percentage points). There have been particularly sharp increases in unemployment in Haringey (6.4 percentage points) and Newham (6.3 percentage points), and outside London in Luton and Blackpool (both 5.0 percentage points).
The differential impact of the crisis across the UK risks deepening pre-existing local inequalities. This threatens the Government’s commitment to ‘levelling up’ prosperity across the UK, with the risk that the country will emerge not just poorer, but also less equal.
Figure 4: Increase in claimant unemployment by local authority ranked by the pre-crisis level of unemployment
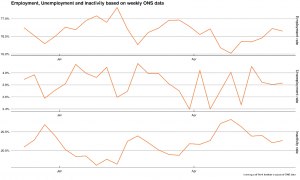
The fall in employment has not yet shown up in official unemployment
The number of people in employment has fallen by 181,000 since March. However, while this fall in employment has been mirrored by an historic increase in the claimant count, the official measure of unemployment has barely shifted. It is actually down 1,000. Even the weekly estimates show a rise of just 42,000.
The official unemployment measure depends on an individuals’ situation and behaviour. People who are not available to start work, or are not seeking work are classified as ‘economically inactive’, rather than unemployed. Most of the hundreds of thousands of people who have lost their jobs during the crisis have been categorised. While inactivity rose substantially by 167,000 between March and May, unemployment increased by only 42,000.
There are three main reasons for this:
Unavailable – many parents have been unable to seek work as they have taken on extra caring responsibilities for school age children;
Discouraged workers – the collapse in vacancy numbers have discouraged many from actively seeking work while some who are self-employed are waiting for restrictions to be eased and business to return;
Universal Credit conditionality – DWP has temporarily suspended conditionality requirements under which most claimants have to seek work.
In addition, the ONS estimate that around 500,000 say they are employed but worked no hours and received no pay.
Figure 5: The decline in employment has shown up in part in a rise in inactivity
Some signs of green shoots?
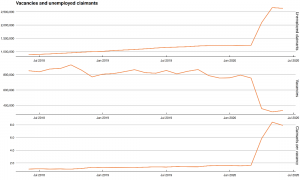
The number of vacancies numbers rose slightly in June. There were 17,000 more vacancies advertised in June, up 5.4%. This mirrors a small rise in economic output (2 percent) in May.
However, vacancy levels remain 58% lower than levels seen in February before the onset of the Coronavirus crisis.
Figure 6: Vacancies have increased but they remain well below pre-crisis levels
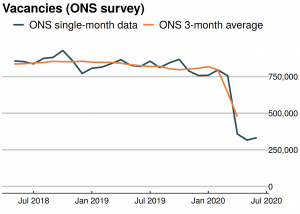
Figure 7: There are now 7.9 unemployed claimants for each vacancy