August 2025
Stephen Evans, chief executive of Learning and Work Institute, said:
The labour market continues to cool with payroll employment down an estimated 164,000 over the past year and vacancies falling for the 37th month in a row. Employment falls are largest in retail and hospitality. These sectors also have the strongest pay growth, so it’s likely the combination of a weak economy, rising minimum wage and employer costs is having an impact on jobs. As well as boosting the economy, we need to widen employment support, with only one in ten out-of-work disabled people getting help to find a job each year.
Dr Helen Gray, chief economist at Learning and Work Institute, said:
It is concerning to see rising numbers of young people joining the ranks of the long-term unemployed in today’s labour market figures. Young people are much more likely to be unemployed than older age groups and the proportion of 16- to 24-year olds not in full-time education or employment has risen over the past year. Long-term unemployment can cause lasting damage to the career prospects of young people, as well as to the economy. It is vital that the Youth Guarantee provides practical support to young people before their problems become intractable.
1. Headline indicators
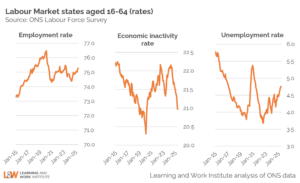
Employment in June 2025 went up by 34,000 on the previous month and rose by 183,000 on the January-March 2025 quarter, to 32,566,000. The employment rate for those aged 16-64 went up to 75.3% compared to 75.0% in the previous quarter.
Economic inactivity for those aged 16-64 fell by 156,000 on the previous quarter to 9.07 million. The economic inactivity rate fell to 21.0% from 21.4% in the last quarter.
Unemployment (for those aged 16-64) went up by 61,000 compared with the previous quarter to 1.63 million. The unemployment rate rose slightly to 4.8% from 4.6% in the previous quarter.
To explore how key labour market indicators have changed over the past 10 years, see our interactive labour market dashboard.
2. Divergence between the Labour Force Survey and other sources in recent years
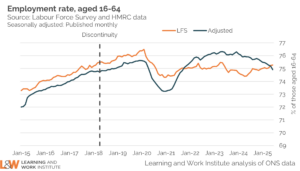
Our headline indicators are based on data from the Labour Force Survey, but since the pandemic this has experienced a decline in the response rate which affects the reliability of estimates from this source. This is illustrated by the divergence in the employment rate estimated from the LFS and other sources over this period. While the ONS seeks to resolve these issues, we are publishing an experimental estimate of the employment rate based on an approach developed by the Resolution Foundation and using administrative data sources, such as HM Revenue and Customs payroll and self-assessment data on the numbers of people self-employed. This measure indicates that in the April-June 2025 quarter, the employment rate for those aged 16 to 64 stood at 74.9%. This was 0.4 percentage points lower than the LFS estimate. We aim to refine this approach in the months ahead.
3. Nominal pay rises continue to outstrip inflation
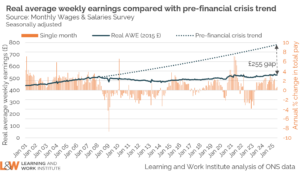
The latest data show average regular earnings grew by 5.0% in the year to June 2025, unchanged on the previous month and down from the post-pandemic peak of 7.9% in August 2023. For public sector workers average regular earnings grew by 5.7% in the year to June 2025, while average regular earnings grew by 4.8% for private sector workers. After taking account of inflation, real regular earnings went up by 0.9% (3-month average change) in the year to June 2025, with the single month data for June showing a real-terms increase of 0.8% over the year.
The rate of inflation rose very slightly from 4.0% in May 2025 to 4.1% in June. In the year to June 2025 core CPIH (excluding energy, food, alcohol and tobacco) rose by 4.3%, up a little on the 4.2% increase seen in the year to May 2025. The rise in the rate of inflation was driven by an increase in the magnitude of price rises for goods, while there was a slight fall in the rate of inflation for services. The inflation rate for good rose from 2.0% in May 2025 to 2.4% in June, while the rate of inflation for services fell very slightly from 5.3% to 5.2% over the same period.
Inflation in areas like Housing and household services, Owner occupiers’ housing costs and Education is still high. In June the UK had the highest rate of inflation in the G7, followed by Japan, where the inflation rate was 3.3%. This compared with an inflation rate of 2.7% in the United States and 2.0% in the Eurozone. Weak growth since the global financial crisis means average earnings are more than £12,000 per year lower than if pre-crisis trends had continued.
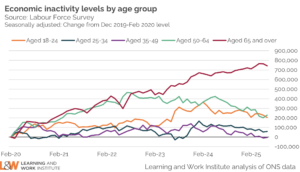
4. There are fewer potential workers for employers to recruit, with nearly 1 million fewer over 50s in the labour market since the pandemic started
Recruitment has been more challenging for employers since the pandemic because of rises in economic inactivity – people leaving the labour market. Although the number of people aged 50 to 64 who are economically inactive now appears to be on a downward trend, the numbers economically inactive remain 7.1% higher than in the period immediately before the pandemic started.
Economic inactivity has fallen in the most recent quarter, with the rate standing at 21.0% for those aged 16 to 64 in April to June 2025 – down from 21.4% in the previous quarter. Overall, the number of those aged 16 to 64 who are economic inactive is 628,000 higher than pre-pandemic, yet only one-in-ten out-of-work older people and people with a disability get employment support each year. The Government needs to extend employment support to more people outside the labour market and employers need to think about recruitment and job design to attract and retain staff.
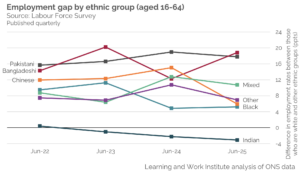
5. Quarterly data on employment rates by ethnic group and by disability show substantial differences remain between groups
In the April to June quarter of 2025 the difference between the employment rates of people who are from a Chinese or other ethnic background, compared with people who are white, narrowed compared with the same quarter one year earlier. By contrast, the size of the gap in the employment rates of white people and those from a Bangladeshi background increased over this period. People from an Indian background are more likely to be employed than people who are white. For those from a mixed, Pakistani, or black ethnic background there was little change in the size of the gap in employment rates compared with people who are white over the past year.
As the figures on employment rates for different ethnic groups are not seasonally adjusted, patterns vary from quarter to quarter and the reweighting of the Labour Force Survey from the January to March quarter of 2019 onwards creates a discontinuity which makes it difficult to compare employment rates over a longer period. Differences in response rates and sample sizes between ethnic groups also result in volatility over time, making it difficult to identify clear patterns. It is therefore generally unclear whether the gap in employment rates compared with people who are white has risen or fallen over the past four years for each of the ethnic groups considered. Most ethnic groups remain substantially less likely to be in employment than people who are white, with the exception of those from an Indian background.
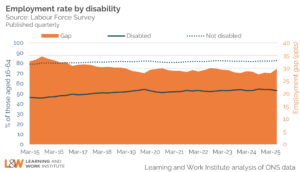
The employment rate for people with a disability has generally been on an upward trajectory over the past 10 years. In the April to June quarter of 2025, 52.8% of people with a disability were employed – almost unchanged on the same quarter one year earlier, when then employment rate for people with a disability stood at 53.1%. The difference in the employment rates of people with a disability and those without a disability has generally narrowed over time but remains substantial and the gap actually rose in the most recent quarter compared with the same quarter one year earlier. In April to June 2025 the employment rate for people with a disability was 29.7 percentage points lower than the employment rate for those without a disability (82.5%).
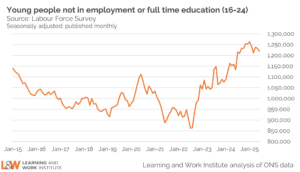
6. The proportion of 16- to 24-year-olds not in employment or full-time education has risen over the past year
The unemployment rate for young people aged between 16 and 24 in the April to June 2025 quarter was 14.1%, 0.7 percentage points higher than the rate in the same quarter one year earlier (13.4%). The number of young people aged between 16 and 24 who are not in employment or full-time education currently stands at 1,220,000. Furthermore, our recent research shows that three in five of these young people have never had a paid job.
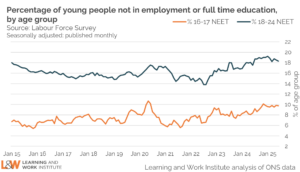
The percentage of those aged 16 to 17 who were not in employment or full-time education was higher in April to June 2025 compared with the same quarter one year earlier (9.7% and 8.4% respectively). Over the same period the percentage of 18-to-24-year-olds who were not in employment or full-time education rose from 17.5% to 18.3%. Our Youth Opportunity Index gives a detailed portrait of the opportunities and challenges for every young person broken down by local education authority.
7. Signs of caution by employers, while 2.0 million people who are economically inactive want a job
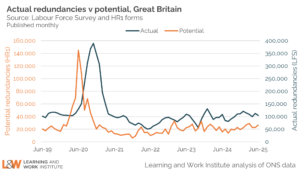
Employers are required to give the Insolvency Service advanced notice of any plans to make 20 or more employees at a single establishment redundant by completing an HR1 form. This gives an estimate of potential redundancies before plans are finalised. The minimum notice period required ranges from 30 to 45 days, depending on the number of employees at risk of redundancy. While there is no advanced notice of most redundancies, information from the HR1 form does provides an early indicator of a possible change in the labour market. For example, a spike in potential redundancies in June 2020 was followed by a peak in the number of people made redundant in the September to November quarter of 2020.
In the April to June 2025 quarter potential redundancies stood at an average of 23,971 a month, down on the monthly average of 26,048 over the previous quarter. This suggests that actual redundancies may start to fall in the coming months.
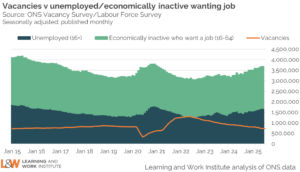
Headline vacancies in the May to July 2025 quarter were down by 44,000 compared with the previous quarter. The headline ONS vacancy figure is both seasonally adjusted and a three-month average. Even with signs that the number of potential redundancies notified is starting to fall, the downward trend in vacancies suggests that employers are currently cautious about the state of the economy.
Using the official measure of unemployment, there are 2.3 unemployed people for every vacancy. However, there are an additional 2.0 million people who are economically inactive but want a job. People in this group will need to be supported to find work if the government is to achieve its ambition of an 80 per cent employment rate.
8. Numbers out-of-work and claiming unemployment-related benefits below the ILO measure of unemployment
From those aged 16 or more, unemployment in the April to June 2025 quarter was 1,672,000. The quarterly headline figure has risen by 59,000 since the January 2025 to March 2025 quarter.
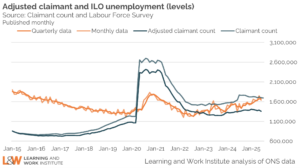
Under Universal Credit, people who are in employment, but on very low earnings are required to search for work. The administrative earnings threshold, below which claimants are required to engage in work search, has increased over time, bringing more employed people into the claimant count. At present, those making an individual claim for Universal Credit are required to look for better-paid work if they earn less than £952 during the month-long assessment period. Those claiming Universal Credit as part of a couple are obliged to look for better-paid work if their combined earnings are less than £1,534 in the assessment period.
Adjusting the claimant count to exclude those who are employed at some point during the month-long assessment period may understate the number of people who are unemployed and claiming out-of-work benefits on a particular day within that period. However, excluding employed claimants means the adjusted claimant count is more comparable with the official quarterly estimate of unemployment.
After excluding 344,065 individuals who were in very low-paid work at some point during the assessment period, 1,357,534 people were unemployed and claiming out-of-work benefits in June 2025. The number of people who were claiming unemployment-related benefits while out-of-work was 315,000 lower than the number unemployed on the official quarterly measure.
9. Unemployment rates remain high for younger people but stabilising for all age groups in recent quarters
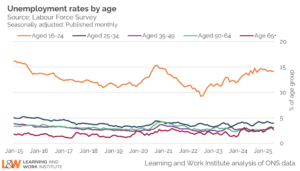
The 16- to 24-year-old unemployment rate (including students) was 14.1% of the economically active in the April to June 2025 quarter. The rate for those aged 25 to 49 was 3.4%. For those aged 50 and over it was 3.1%. Compared with the previous quarter the unemployment rate is almost unchanged for all age groups. For 16- to 24-year-olds the unemployment rate was down by less than 0.1 percentage point in the most recent quarter compared with the January to March quarter of 2025, for those aged 25 to 49 it was up by 0.1 percentage point and for those aged 50 or more it rose by 0.2 percentage points. Compared with one year earlier, the unemployment rate for 16-to-24-year-olds was 0.7 percentage points higher in the April to June 2025 quarter, while it was slightly higher for those aged 25 to 49 (up by 0.3 percentage points) and up by 0.6 percentage points for those aged 50 or more.
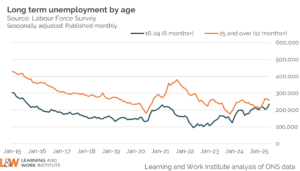
10. Youth long-term unemployment rising, but signs adult long-term unemployment reaching a plateau
Youth long-term unemployment (which can include students) has risen over the last quarter and stood at 235,000 in April to June 2025. It has risen by 67,000 over the past year. Long-term unemployment for young people is normally counted as being unemployed for six months or more.
Adult long-term unemployment on the survey measure was 258,000 in the April to June 2025 quarter. The number of people aged 25 and over out of work for 12 months or more was up by 18,000 in the most recent quarter compared with the previous quarter (January to March 2025). Compared with the same quarter one year earlier, adult long-term unemployment has risen by 11,000.
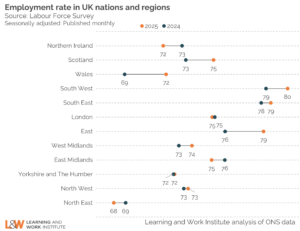
11. The employment picture varies across the country
The smaller sample sizes underlying regional estimates of employment and economic inactivity mean that caution is needed in interpreting changes over time. However, employment rates in the April to June 2025 quarter were higher than the equivalent quarter one year earlier in Scotland, Wales, the South West, South East and East of England and the West Midlands. Wales saw the largest increase in the employment rate, at 2.9 percentage points. By contrast, employment rates in April to June 2025 were lower than they had been one year earlier in Northern Ireland, the East Midlands and the North East of England. The fall in the employment rate over this period was greatest in Northern Ireland, where it declined by 1.3 percentage points. In London, Yorkshire and the Humber and the North West there was little change in the employment rate compared with one year earlier.
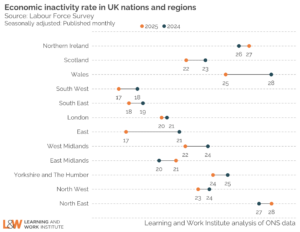
The rate of economic inactivity in the April to June 2025 quarter was lower than it was one year earlier in Scotland, Wales, the South West, the South East, the East of England, the West Midlands, Yorkshire and the Humber and the North West. The reduction in economic inactivity was greatest in the East of England, where it fell by3.9 percentage points over this period. In Northern Ireland, the East Midlands and the North East, the rate of economic inactivity rose compared with one year earlier. The increase in the rate of economic inactivity was most pronounced in the East Midlands, which saw a rise of 1.2 percentage points. This varying picture, which is even greater at sub-regional level, shows the importance of tackling inequalities so everyone has a fair chance in life wherever they live.
Navigate our labour market dashboard
Explore our latest interactive charts and analysis